Golden Cross Moving Average Trading Strategy

Overview
The golden cross moving average trading strategy is a very simple moving average trading strategy. Its trading signals come from the golden cross of two simple moving averages (SMA) with different cycles. Specifically, a buy signal is generated when the faster cycle SMA crosses above the slower cycle SMA from below. A sell signal is generated when the faster cycle SMA crosses below the slower cycle SMA from above.
Strategy Principle
The strategy uses two moving averages: a 50-period SMA fast line and a 200-period SMA slow line.
When the SMA fast line breaks through the SMA slow line from below, a buy signal is generated, indicating a bull market is coming. This kind of breakthrough is called a "golden cross". When the SMA fast line breaks through the SMA slow line from above, a sell signal is generated, indicating a bear market is coming. This kind of breakthrough is called a "death cross".
The strategy only goes long without shorting. That is to say, it only buys at the golden cross and sells out at the death cross. Besides that, there is no stop loss or take profit logic set in the strategy.
Advantage Analysis
The biggest advantage of this strategy is that it is very simple and intuitive. Moving averages are widely considered an effective technical indicator for displaying changes in market trends. This strategy takes advantage of this key feature of moving averages to determine the long-term trend of the market.
Another advantage is that the parameter settings are relatively fixed. The choice of 50-period and 200-period has some rationale and does not need frequent adjustment, suitable for long-term holding.
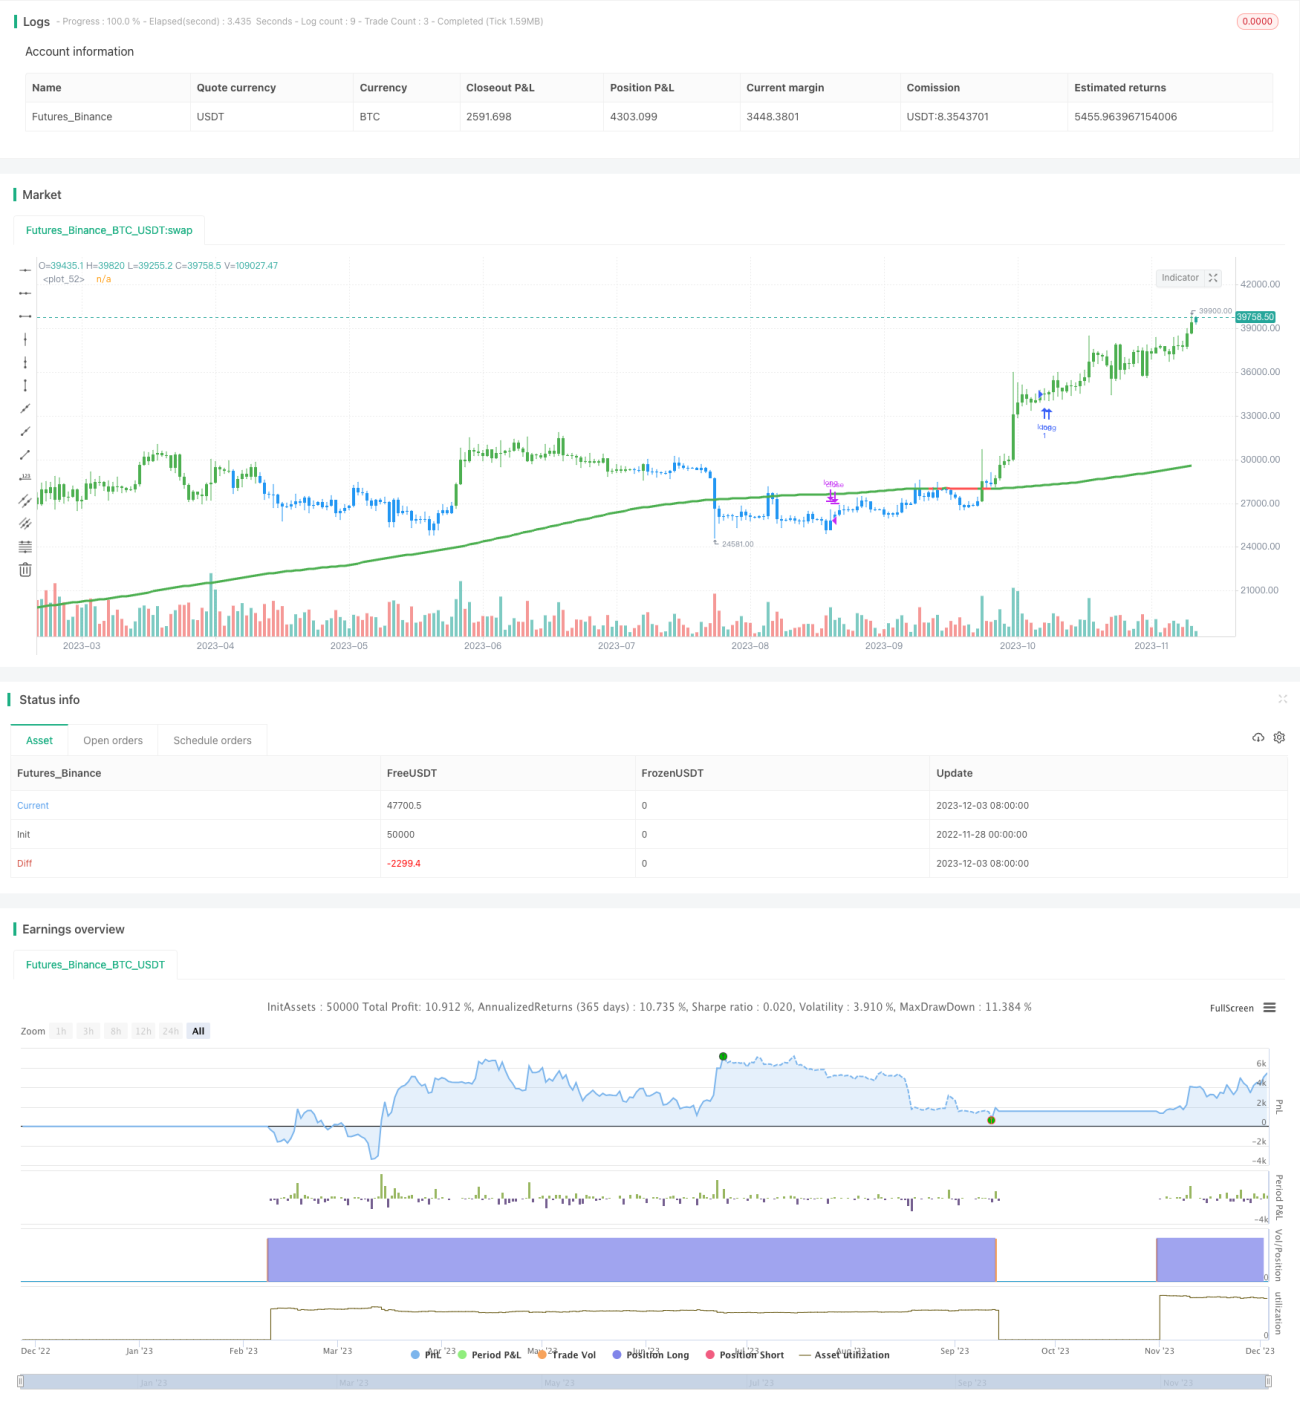
Judging from historical data, this simple moving average strategy has achieved decent results.
Risk Analysis
The biggest risk of this strategy also comes from its over-simplification. As there is no stop loss logic set, it may face relatively large single losses. This is not beneficial for risk management.
In addition, moving averages themselves have some lagging. Signal generation requires some confirmation and may miss short-term trading opportunities.
Optimization
Other technical indicators can be considered to be incorporated into the strategy to build a more complex trading system and improve profitability and win rate. For example, oscillators like the relative strength index (RSI) can be added to capture short-term signals.
On the other hand, the money management strategy can also be optimized. Setting reasonable stop loss and take profit can effectively control risks, which is a common practice for this type of trend tracking strategy.
Summary
The golden cross moving average trading strategy is a highly simplified trend tracking strategy. It uses the golden cross and death cross of moving averages to determine changes in the long-term trend of the market, based on which trading signals are generated. The advantage of this strategy lies in its being very simple and intuitive, easy to understand and follow, and its decent historical performance. But at the same time, it also faces certain risks, especially the lack of control in terms of stop loss and take profit. In the future, the strategy can be made more robust and reliable by adding other indicators or optimizing capital management.
/*backtest
start: 2022-11-28 00:00:00
end: 2023-12-04 00:00:00
period: 1d
basePeriod: 1h
exchanges: [{"eid":"Futures_Binance","currency":"BTC_USDT"}]
*/

//@version=2
strategy("Golden Cross, SMA 200 Long Only, Moving Average Strategy (by ChartArt)", shorttitle="CA_-_Golden_Cross_Strat", overlay=true)

// ChartArt's Golden Cross Strategy- 1