Cross Moving Average Golden Cross Death Cross Strategy

Author: ChaoZhang, Date: 2023-12-05 11:11:02
Tags:

img

This is a very classic moving average golden cross death cross strategy. The strategy utilizes two moving averages, TENKAN and KIJUN, with different time periods to form golden cross and death cross signals for long and short trades.

Strategy Logic

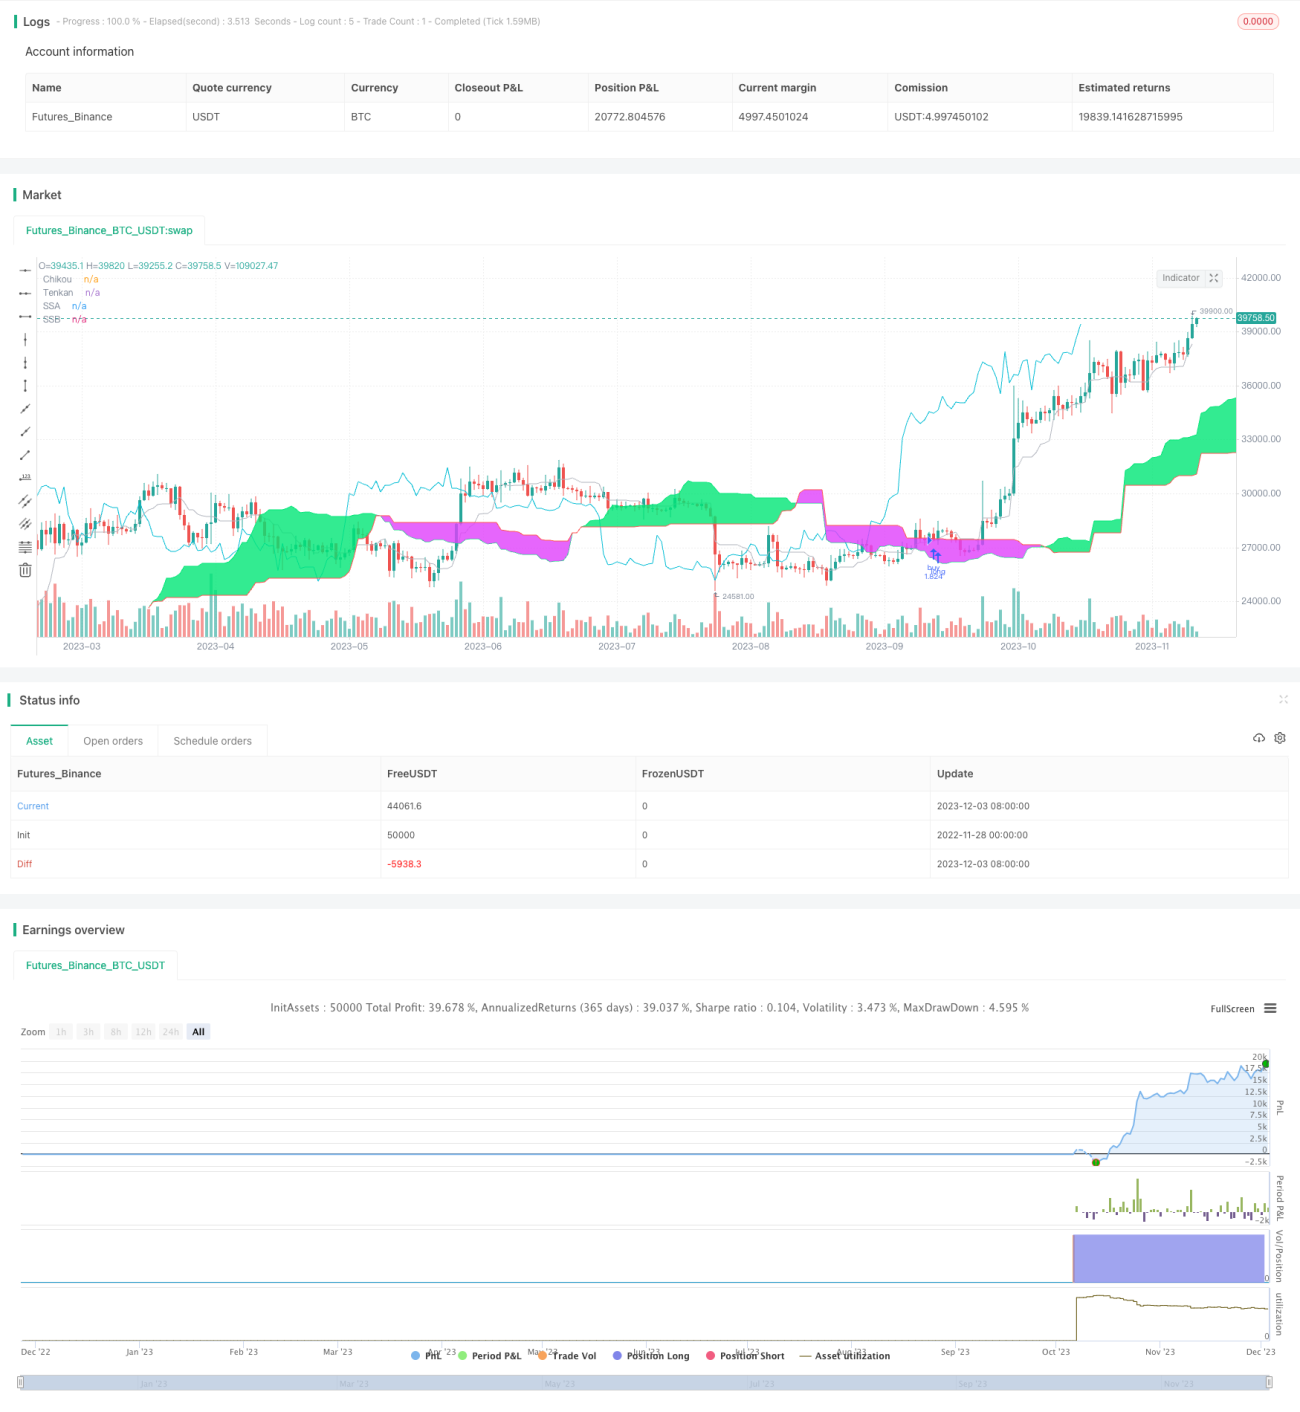
The strategy is mainly based on a Japanese stock technical analysis method called Ichimoku Kinko Hyo, using multiple moving averages like the TENKAN and KIJUN lines to determine the market trend direction.

Firstly, the TENKAN line is a 9-day line representing the short-term trend; the KIJUN line is a 26-day line representing the medium-term trend. When the TENKAN line crosses above the KIJUN line, a buy signal is generated. When the TENKAN line falls below the KIJUN line, a sell signal is generated. This forms the classic moving average golden cross and death cross strategy.

Secondly, the strategy also introduces the Senkou Span A (SSA) line and the Senkou Span B (SSB) line. The SSA line is the average of TENKAN and KIJUN lines while the SSB line is a 52-day moving average. Together they form the “Kumo” (cloud) bands that determine the long-term trend direction - price above the cloud signifies an uptrend while price below the cloud signifies a downtrend.

Lastly, to filter fake signals, this strategy also examines the position of price compared to the Chikou Span (the closing price delayed by 26 days) – only generating buy signals when the price is below Chikou and sell signals when the price is above Chikou.

Benefits

This is a very typical moving average strategy. The main advantages lie in:

  1. Using two moving averages of different periods effectively judges short-term and medium-term trend directions simultaneously.

  2. Long-term trends are determined with the Kumo bands to avoid buying in long-term bear markets.

  3. Comparing prices with the delayed Chikou line filters out a lot of fake signals and reduces unnecessary trades.

By skillfully utilizing various functions of moving averages, this strategy can follow trends across short, medium and long timeframes.

Risks

The main risks of this strategy include:

  1. Moving average strategies tend to produce many fake signals. Frequent trading caused by inaccurate parameters may lead to losses.

  2. This strategy focuses heavily on technicals without considering fundamentals. Major changes in business performance or market policies may invalidate the technical signals.

  3. No stop loss mechanism is included. Once the market direction judgment is wrong, losses can accumulate.

Therefore, we need more advanced moving average systems, proper stop loss rules, or supplemental fundamental signals, to further refine this strategy and decrease risks.

Enhancement Opportunities

This strategy can also be improved in the following aspects:

  1. Search for more stable and efficient parameter sets through more backtests.

  2. Add stop loss rules. Reasonable stop loss helps effectively control maximum losses.

  3. Supplement fundamental signals like earnings estimate revisions which contain insights on a company’s outlook.

  4. Optimize the Chikou line price comparison strategy with more stable solutions.

  5. Incorporate stock selection signals. Scoring factors like PE ratio and ROE can filter lower quality stocks.

Conclusion

This is a very typical and practical moving average strategy. By simultaneously monitoring short, medium and long-term trends, utilizing various functions of moving averages, it generates trade signals with solid performance. We can further improve it by parameter tuning, adding stop loss, stock selection etc. Overall this is a promising quantitative strategy worthy of research and tracking.


/*backtest
start: 2022-11-28 00:00:00
end: 2023-12-04 00:00:00
period: 1d
basePeriod: 1h
exchanges: [{"eid":"Futures_Binance","currency":"BTC_USDT"}]
*/

// This source code is subject to the terms of the Mozilla Public License 2.0 at https://mozilla.org/MPL/2.0/
// © mdeous

//@version=4
strategy(
     title="Ichimoku Kinko Hyo Strategy", 
     shorttitle="Ichimoku Strategy", 
     overlay=true,
     pyramiding=0,
     default_qty_type=strategy.percent_of_equity,
     default_qty_value=100,
     initial_capital=1000,
     currency="USD",
     commission_type=strategy.commission.percent,
     commission_value=0.0
     )

//
// SETTINGS
//

// Ichimoku

int TENKAN_LEN = input(title="Tenkan-Sen Length", defval=9, minval=1, step=1)
int KIJUN_LEN = input(title="Kijun-Sen Length", defval=26, minval=1, step=1)
int SSB_LEN = input(title="Senkou Span B Length", defval=52, minval=1, step=1)
int OFFSET = input(title="Offset For Chikou Span / Kumo", defval=26, minval=1, step=1)

// Strategy

int COOLDOWN = input(title="Orders Cooldown Period", defval=5, minval=0, step=1)
bool USE_CHIKOU = input(title="Use Imperfect Chikou Position Detection", defval=false)

//
// HELPERS
//

color _red = color.red
color _blue = color.blue
color _lime = color.lime
color _fuchsia = color.fuchsia
color _silver = color.silver
color _aqua = color.aqua

f_donchian(_len) => avg(lowest(_len), highest(_len))

//
// ICHIMOKU INDICATOR
//

float tenkan = f_donchian(TENKAN_LEN)
float kijun = f_donchian(KIJUN_LEN)
float ssa = avg(tenkan, kijun)
float ssb = f_donchian(SSB_LEN)

plot(tenkan, title="Tenkan", color=_silver)
plot(close, title="Chikou", offset=-OFFSET+1, color=_aqua)
_ssa = plot(ssa, title="SSA", offset=OFFSET-1, color=_lime)
_ssb = plot(ssb, title="SSB", offset=OFFSET-1, color=_red)
fill(_ssa, _ssb, color=ssa > ssb ? _lime : _fuchsia, transp=90)

//
// STRATEGY
//

// Check if price is "above or below" Chikou (i.e. historic price line):
// This detection is highly imperfect, as it can only know what Chikou position
// was 2*offset candles in the past, therefore if Chikou crossed the price
// line in the last 2*offset periods it won't be detected.
// Use of this detection is disabled by default,

float _chikou_val = close[OFFSET*2+1]
float _last_val = close[OFFSET+1]
bool above_chikou = USE_CHIKOU ? _last_val > _chikou_val : true
bool below_chikou = USE_CHIKOU ? _last_val < _chikou_val : true

// Identify short-term trend with Tenkan

bool _above_tenkan = min(open, close) > tenkan
bool _below_tenkan = max(open, close) < tenkan

// Check price position compared to Kumo

bool _above_kumo = min(open, close) > ssa
bool _below_kumo = max(open, close) < ssb

// Check if Kumo is bullish or bearish

bool bullish_kumo = ssa > ssb
bool bearish_kumo = ssa < ssb

// Correlate indicators to confirm the trend

bool bullish_trend = _above_tenkan and _above_kumo and bullish_kumo
bool bearish_trend = _below_tenkan and _below_kumo and bearish_kumo

// Build signals

bool buy1 = (close > open) and ((close > ssa) and (open < ssa)) // green candle crossing over SSA
bool buy2 = bullish_kumo and bearish_kumo[1] // bullish Kumo twist

bool sell1 = (close < open) and ((close < ssb) and (open > ssb)) // red candle crossing under SSB
bool sell2 = bearish_kumo and bullish_kumo[1] // bearish Kumo twist

bool go_long = below_chikou and (bullish_trend and (buy1 or buy2))
bool exit_long = above_chikou and (bearish_trend and (sell1 or sell2))

//
// COOLDOWN
//

f_cooldown() =>
    _cd_needed = false
    for i = 1 to COOLDOWN by 1
        if go_long[i]
            _cd_needed := true
            break
    _cd_needed

go_long := f_cooldown() ? false : go_long

//
// ORDERS
//

strategy.entry("buy", strategy.long, when=go_long)
strategy.close_all(when=exit_long)

//
// ALERTS
//

alertcondition(
     condition=go_long,
     title="Buy Signal",
     message="{{exchange}}:{{ticker}}: A buy signal for {{strategy.market_position_size}} units has been detected (last close: {{close}})."
     )
alertcondition(
     condition=exit_long,
     title="Sell Signal",
     message="{{exchange}}:{{ticker}}: A sell signal for {{strategy.market_position_size}} units has been detected (last close: {{close}})."
     )


More