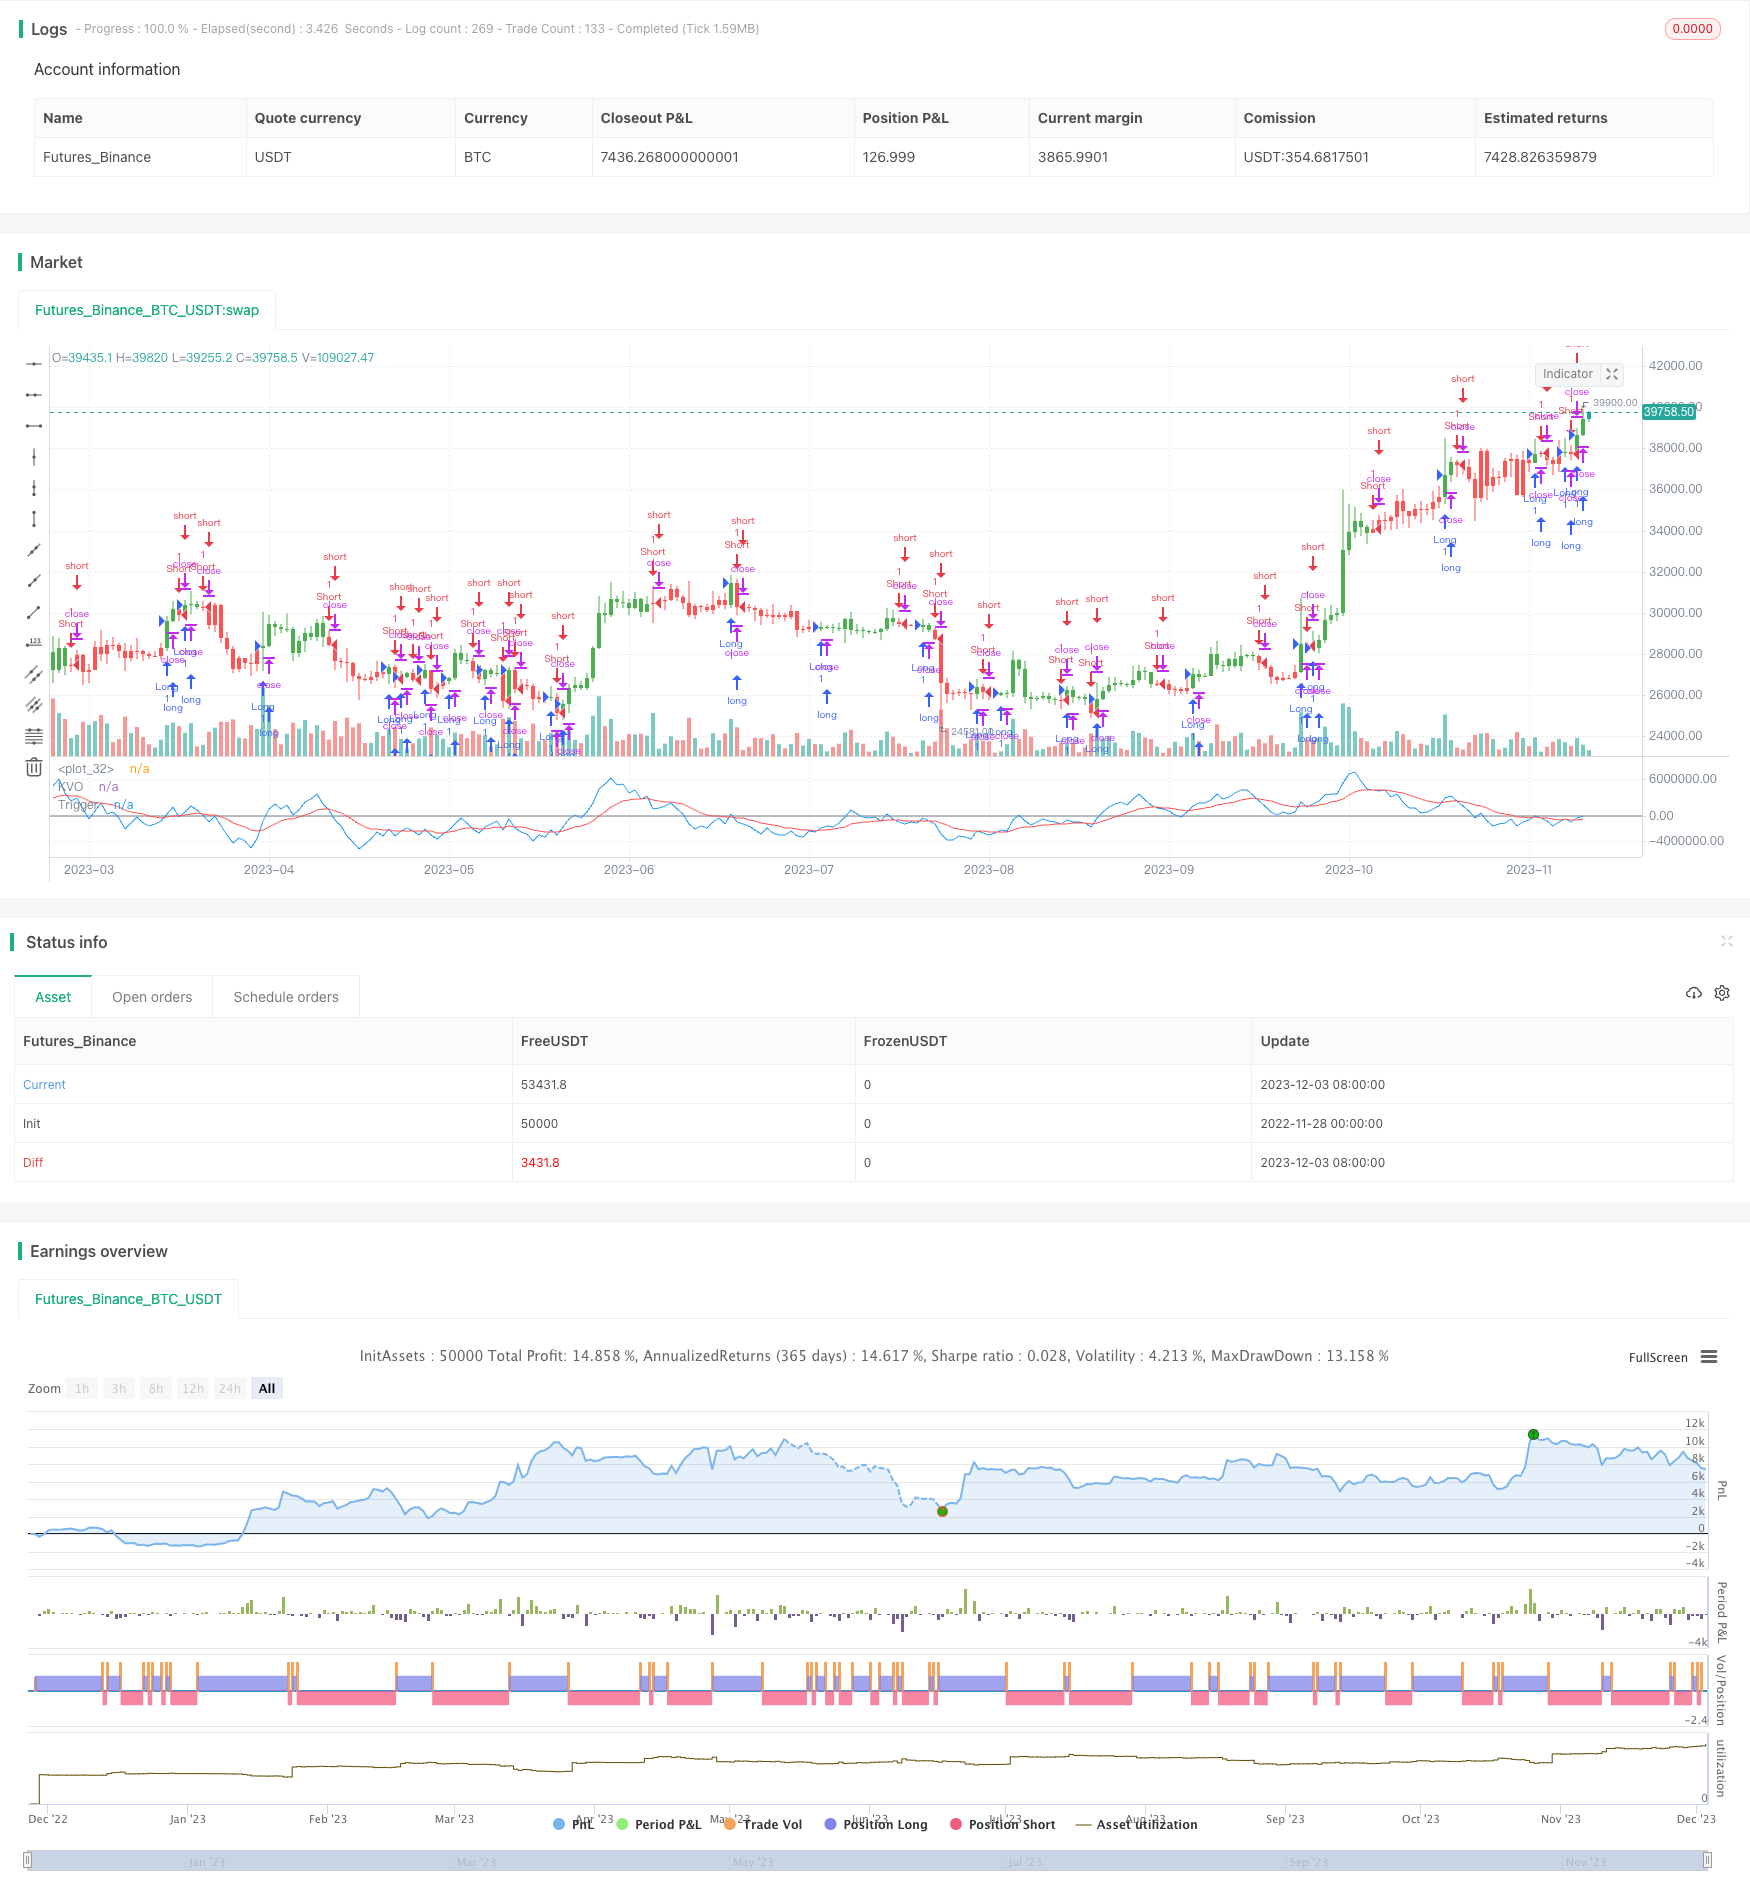
这是一个基于Klinger量化指标的交易策略。该策略捕捉价格波动中买卖力量的变化,以发现市场趋势的转折点。其优点是灵敏和准确,能同时适用于短期和长期分析。但是也存在一些风险需要注意。
策略原理
该策略建立在以下理论基础之上:
- 价格范围(最高价-最低价)反映了价格波动幅度,而成交量是价格波动的动力。
- 当日最高价+最低价+收盘价之和较前一日的和大,表示买方力量增强,积累的特征;相反则是分配的特征。
- 成交量的持续变化反映了买卖双方力量的变化。
根据这些理论,该策略通过比较收盘价的总和与前一日的大小关系,结合成交量变化,计算Klinger量化指标。当指标上穿其自身的均线时做多,下穿时做空。
具体来说,策略内置三个指标:
- xTrend:反映价格波动趋势的力量,基于当日收盘价总和与前一日的比较。
- xFast:xTrend的快速均线,参数为34天。
- xSlow:xTrend的慢速均线,参数为55天。
然后计算差值xKVO作为交易指标。当其上穿13天均线xTrigger时做多,下穿时做空。
策略优势
该策略最大的优势是同时适合短期和长期分析。快慢均线的参数设置使得它能够灵敏捕捉短期趋势的变化。与此同时,也能过滤掉短期市场噪音,抓住长期趋势。这是很多跟踪价格本身的指标难以做到的。
此外,该策略仅基于价格和成交量计算。不需要计算复杂的数学指标,计算效率高,适合实盘应用。
风险与对策
该策略最大的风险在于成交量指标对假突破的辨别能力较弱。当价格出现短期调整向上突破均线时,该策略可能会发出错误的做多信号。这时需要结合其他因素判断趋势。
此外,该策略对参数设定较为敏感。快慢均线和交易均线的参数需要反复测试和优化,以获得最佳表现。
策略优化
根据风险分析,我们可以从以下几个方面进一步优化该策略:
增加止损机制。当价格回落一定比例时止损退出,可以减少短期调整的噪音干扰。
增加趋势过滤指标。结合MACD等指数移动平均指标判断市场总体走势,避免在震荡行情中错失方向。
优化参数设置。通过历史回测数据寻找最佳的参数组合,提高策略稳定性。
前期资金管理优化。如根据止赢止损情况动态调整仓位。
总结
本策略通过比较价格的总量与成交量的关系,捕捉市场买卖力量的变化,同时兼顾灵敏度与稳定性。在优化参数设定和结合趋势判断的前提下,可以获得不错的表现。但交易者仍需警惕指标本身的局限性带来的风险。
||
This is a trading strategy based on the Klinger Volume Oscillator. It captures the shifts in buying and selling forces during price fluctuations to identify turning points in market trends. The advantages are sensitivity and accuracy for both short-term and long-term analysis. However, some risks need to be noticed.
Strategy Logic
The strategy is built on the following assumptions:
- The price range (high-low) reflects the amplitude of price swings, while volume is the driving force behind price movements.
- If today’s sum of high + low + close is greater than yesterday’s, it indicates strengthened buying forces and accumulation; the opposite suggests distribution.
- Continuous changes in volume reflect shifts in the forces of buyers and sellers.
Based on the theories, the strategy calculates the Klinger Volume Oscillator by comparing the relationship between today’s sum of closing prices and yesterday’s, combined with changes in volume. It goes long when the indicator crosses above its moving average line, and goes short on crosses below.
Specifically, there are three main indicators involved:
- xTrend: reflects the force of price trend based on comparison of sum of prices between days.
- xFast: fast EMA of xTrend with period of 34.
- xSlow: slow EMA of xTrend with period of 55.
The difference xKVO is then calculated as the trading indicator. Go long on crossing above 13-day EMA xTrigger, and short on crossing below.
Advantages
The greatest advantage is being suitable for both short-term and long-term analysis simultaneously. The fast and slow EMA settings make it sensitive to catch short-term swings, while also filtering out market noise and capturing long-term trends, which most price-based indicators struggle with.
In addition, it is purely based on price and volume data without complex math. This makes it highly efficient for actual trading applications.
Risks & Solutions
The main risk is weaker ability to distinguish false breakouts. Short-term price adjustments may generate wrong long signals. Other factors should be considered to determine the trend.
Also, the strategy is sensitive towards parameter tuning. Optimization is required on the EMAs and trigger line to find best performance.
Strategy Optimization
Some aspects that could further optimize the strategy according to the risks:
Add stop loss mechanisms. Exiting at some percentage retracement reduces noise interference.
Add trend filtering with indicators like MACD to avoid directional mistakes in ranging markets.
Optimize parameter sets through backtests to improve robustness.
Capital management optimization such as dynamic position sizing based on stop loss/take profit levels.
Conclusion
Overall, the strategy captures shifts in market forces by comparing price quantities and volumes for both sensitivity and stability. It can perform well given optimized parameters and trend validation, but inherent limitations of volume indicators can still pose risks for traders.
[/trans]
/*backtest
start: 2022-11-28 00:00:00
end: 2023-12-04 00:00:00
period: 1d
basePeriod: 1h
exchanges: [{"eid":"Futures_Binance","currency":"BTC_USDT"}]
*/

//@version=2
////////////////////////////////////////////////////////////
//  Copyright by HPotter v1.0 30/08/2017
// The Klinger Oscillator (KO) was developed by Stephen J. Klinger. Learning
// from prior research on volume by such well-known technicians as Joseph Granville,
// Larry Williams, and Marc Chaikin, Mr. Klinger set out to develop a volume-based
// indicator to help in both short- and long-term analysis.
// The KO was developed with two seemingly opposite goals in mind: to be sensitive
// enough to signal short-term tops and bottoms, yet accurate enough to reflect the
// long-term flow of money into and out of a security.
// The KO is based on the following tenets:
// Price range (i.e. High - Low) is a measure of movement and volume is the force behind
// the movement. The sum of High + Low + Close defines a trend. Accumulation occurs when
// today's sum is greater than the previous day's. Conversely, distribution occurs when
// today's sum is less than the previous day's. When the sums are equal, the existing trend
// is maintained.
// Volume produces continuous intra-day changes in price reflecting buying and selling pressure.
// The KO quantifies the difference between the number of shares being accumulated and distributed
// each day as "volume force". A strong, rising volume force should accompany an uptrend and then
// gradually contract over time during the latter stages of the uptrend and the early stages of
// the following downtrend. This should be followed by a rising volume force reflecting some
// accumulation before a bottom develops.
//
// You can change long to short in the Input Settings
// Please, use it only for learning or paper trading.
////////////////////////////////////////////////////////////
strategy(title="Klinger Volume Oscillator (KVO)", shorttitle="KVO")
TrigLen = input(13, minval=1)
FastX = input(34, minval=1)
SlowX = input(55, minval=1)
reverse = input(false, title="Trade reverse")
hline(0, color=gray, linestyle=line)
xTrend = iff(hlc3 > hlc3[1], volume * 100, -volume * 100)
xFast = ema(xTrend, FastX)
xSlow = ema(xTrend, SlowX)
xKVO = xFast - xSlow
xTrigger = ema(xKVO, TrigLen)
pos = iff(xKVO > xTrigger, 1,
	   iff(xKVO < xTrigger, -1, nz(pos[1], 0)))
possig = iff(reverse and pos == 1, -1,
          iff(reverse and pos == -1, 1, pos))
if (possig == 1)
    strategy.entry("Long", strategy.long)
if (possig == -1)
    strategy.entry("Short", strategy.short)
barcolor(possig == -1 ? red: possig == 1 ? green : blue )
plot(xKVO, color=blue, title="KVO")
plot(xTrigger, color=red, title="Trigger")