Moving Average Crossover Strategy

Overview
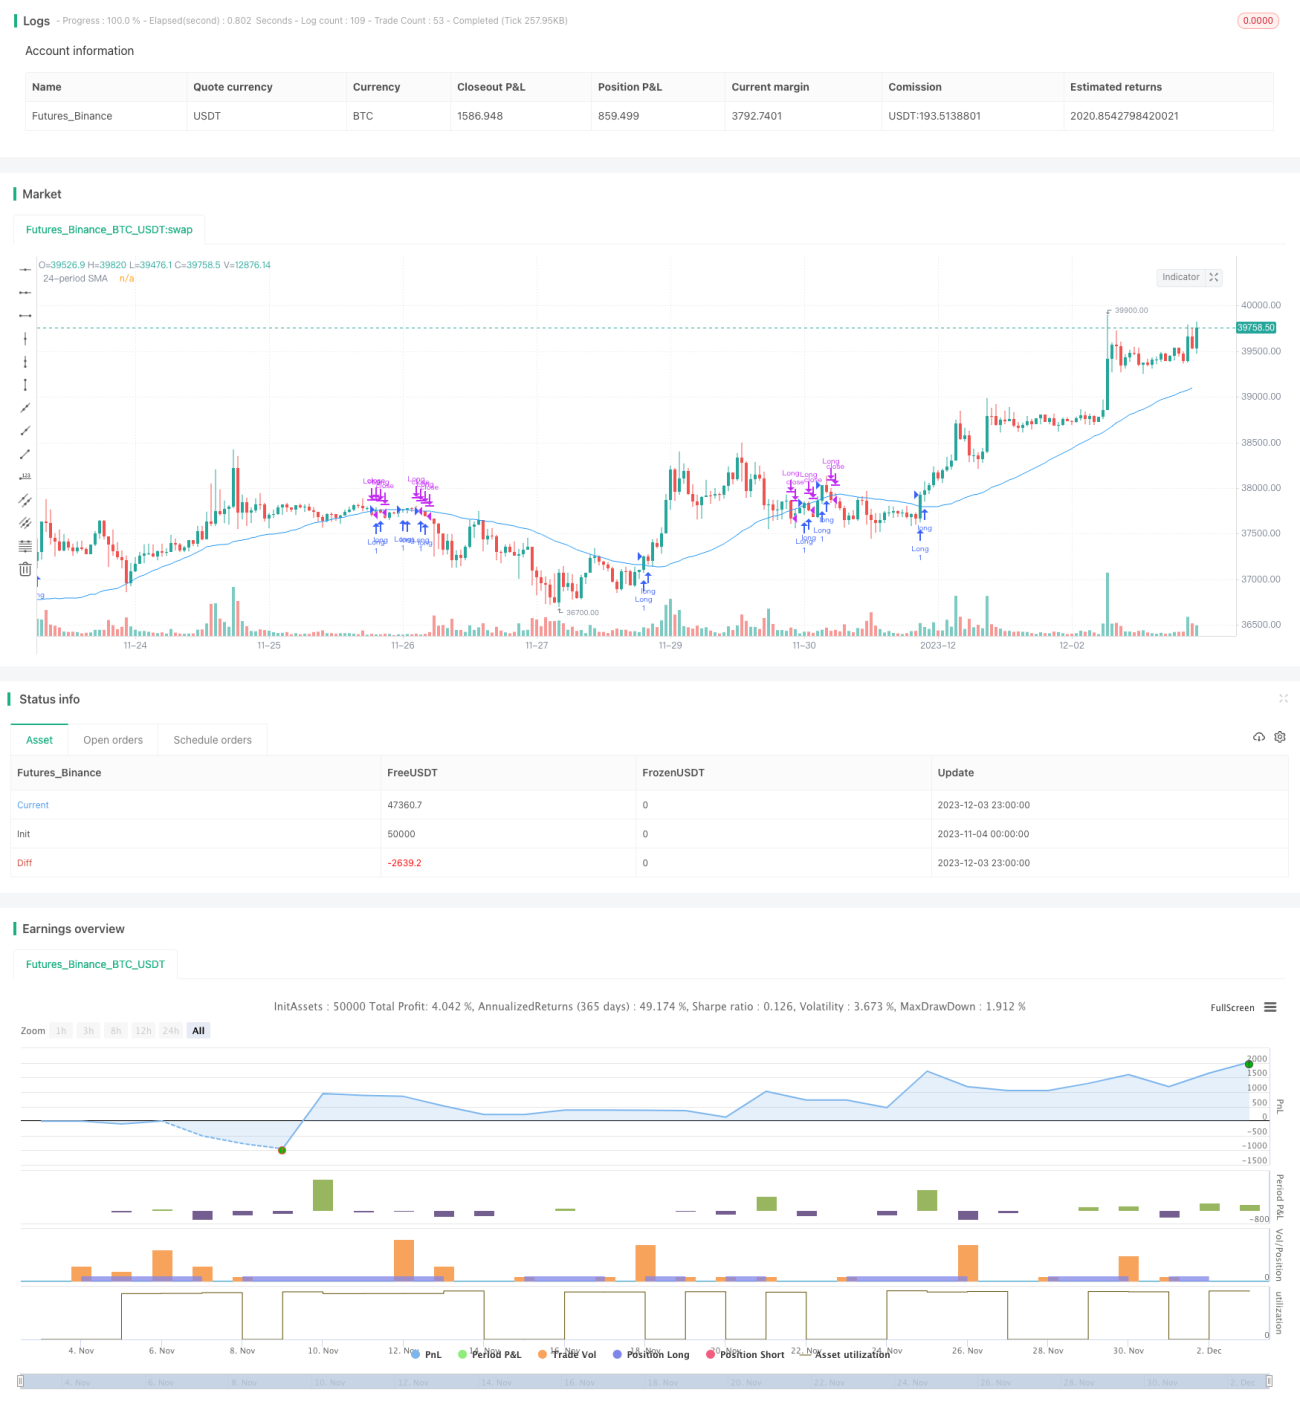
The moving average crossover strategy is a quantitative trading strategy based on technical indicators. It judges the trend direction of the market by calculating the crossover relationship between two moving average lines, and generates corresponding trading signals.
Strategy Logic
The core indicators of this strategy are two moving average lines: a longer 40-period simple moving average (SMA) and the closing price of the stock. When the closing price breaks through the 40-period SMA from below, it indicates that the market trend may reverse and the stock may enter a new uptrend. At this point, the strategy will generate a long signal. When the closing price falls below the 40-period SMA, it indicates that the uptrend of the stock has ended and it may enter a downtrend channel. The strategy will close long positions at this time.
By comparing the breakthrough relationship between closing price and SMA, the turning points of the price trend can be captured to make trading decisions according to the trend direction.
Advantages of the Strategy
The strategy has the following advantages:
- Simple and clear rules that are easy to understand and implement.
- Can effectively capture the reversal of stock mid-to-long term trends and timely adjust positions.
- The SMA indicator has a certain filtering effect on abnormal price movements and can reduce false signals.
- Customizable SMA parameters, applicable to different trading varieties and cycles.
Risks of the Strategy
There are also the following risks:
- As a trend tracking tool, the SMA indicator lags in responding to sudden events.
- Frequent trading and whipsaw may increase trading costs and locked profit risks.
- Improper parameter settings may lead to overtrading or missing opportunities.
Risks can be controlled by adjusting SMA parameters, setting stop loss lines, etc.
Optimization Directions
The strategy can also be optimized in the following aspects:
- Add comparisons of multiple moving averages to form a filter to reduce false signals.
- Incorporate other indicators such as trading volume and graph rector to enhance reliability.
- Dynamically optimize SMA parameters to automatically adapt them to market changes.
- Set stop loss mechanisms with compound conditions to control single transaction loss.
Summary
The moving average crossover strategy judges trend reversal by comparing price changes with the SMA relationship. It is a relatively classic rule-based trading strategy. The strategy is simple to implement, easy to follow mid-to-long term trends for profit, while there are also certain risks of profit retracement and lagging identification. Risks can be controlled and decision effectiveness improved by parameter settings and incorporating other indicators.
- 1