Hybrid Moving Average Breakout Turtle Trading Strategy

Author: ChaoZhang, Date: 2023-12-05 15:01:56
Tags:

img

Overview

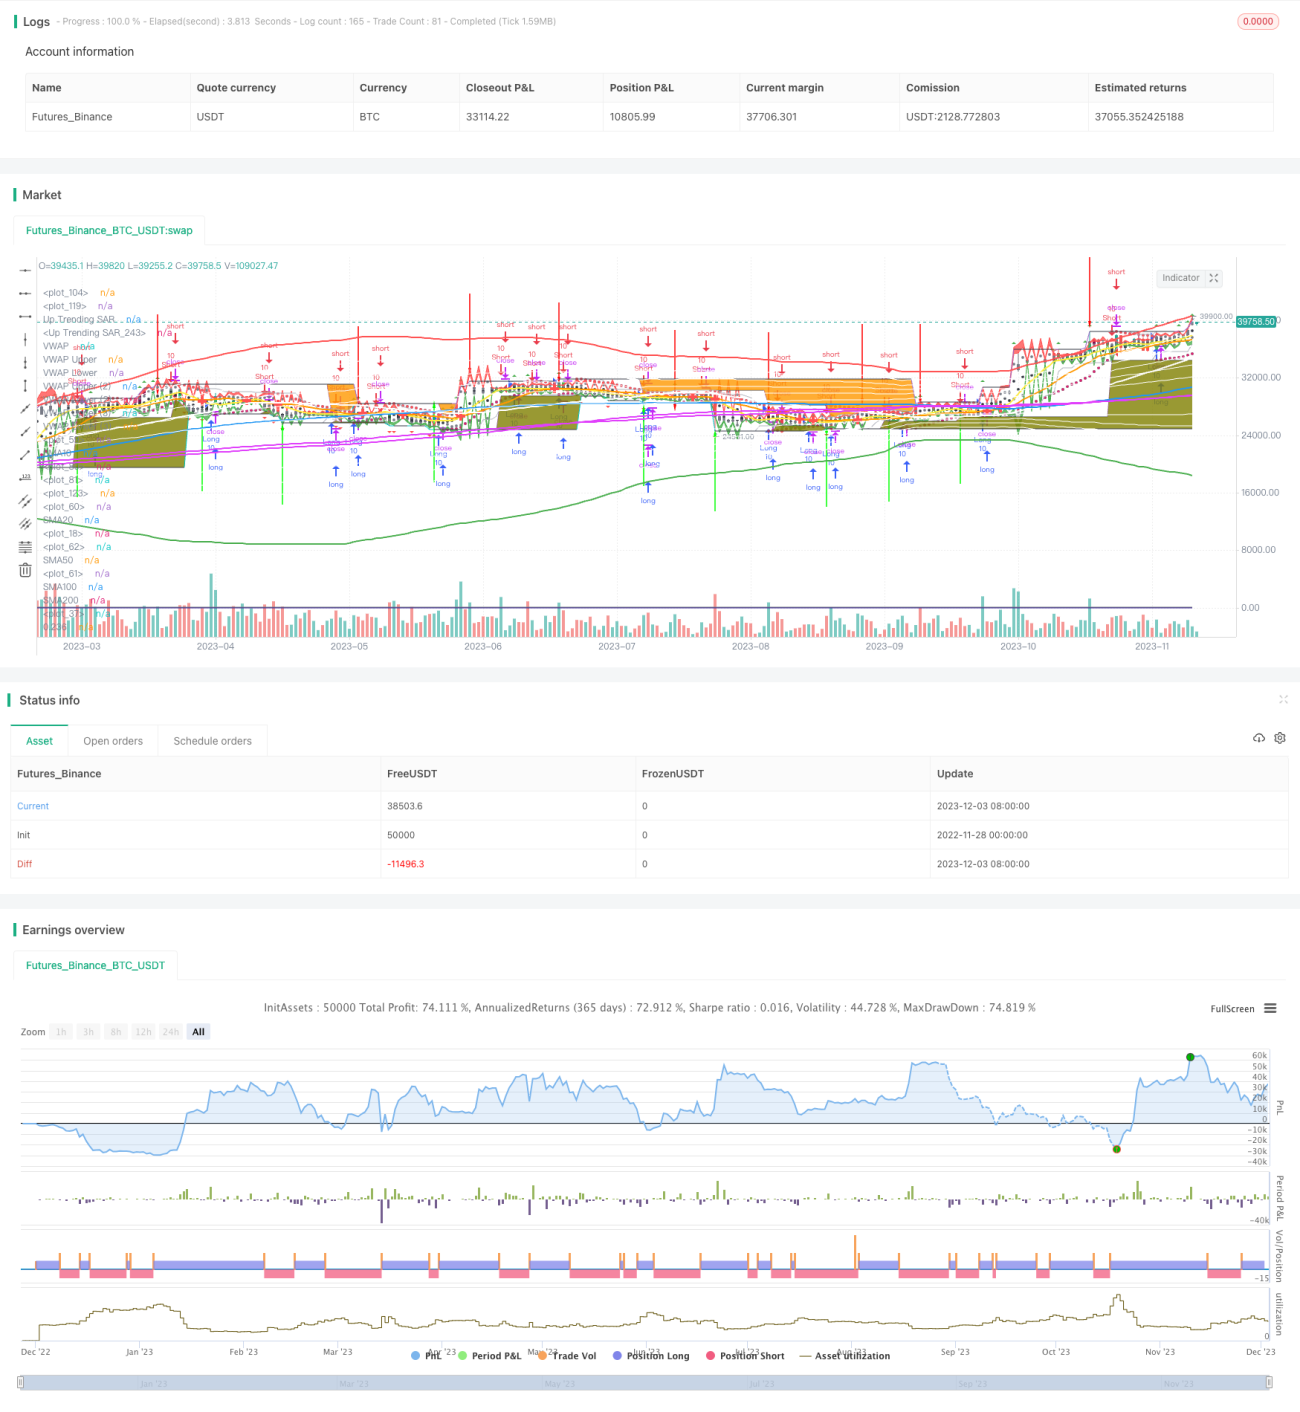
This strategy combines various technical analysis tools such as moving averages, volatility indicators, volume weighted average price (VWAP) and parabolic SAR stop loss to implement a hybrid Turtle trading strategy with strong breakout identification and stop loss protection capabilities.

Strategy Logic

  1. Use SMA combos of different periods to determine trend direction and potential breakout points
  2. Apply Bollinger Bands based on volatility to identify short-term overbought/oversold situations
  3. Utilize VWAP to determine mid-long term fair value price range
  4. Parabolic SAR as stop loss indicator to cut losses
  5. Turtle trading rules to generate trading signals

Advantage Analysis

  1. More comprehensive judgment with integration of multiple indicators, more accurate signals
  2. VWAP helps determine reasonable price range, avoid chasing highs blindly
  3. SAR stop loss effectively controls loss for each position
  4. Turtle trading rules ensure proper entry timing

Risk Analysis

  1. Improper parameter settings may lead to too high trading frequency or signal misjudgment
  2. Single stop loss method limits profit potential
  3. Turtle signals need proper filtration to avoid conflicts

Optimization Directions

  1. Fine tune SMA periods for better breakout identification
  2. Adjust volatility parameters to make Bollinger Bands adhere closer to prices
  3. Optimize parabolic parameters for more precise stop loss
  4. Add other indicators to filter Turtle signals

Conclusion

This strategy forms a relatively accurate signaling, strong stop loss capability, and highly optimizable breakout style Turtle strategy through seamless integration of multiple indicators. With proper parameter tuning, its breakout identification and stop loss protection abilities can be further enhanced, making it a recommended quantitative trading strategy.


/*backtest
start: 2022-11-28 00:00:00
end: 2023-12-04 00:00:00
period: 1d
basePeriod: 1h
exchanges: [{"eid":"Futures_Binance","currency":"BTC_USDT"}]
*/

//@version=4
strategy("Gui's Turtle", shorttitle = "Guis Turtles", overlay=true, pyramiding=0, default_qty_value = 10)

//This script has to be used with Heikin Ashi Caddles for the strategy to work well
//Thank you to all the ones that have their scripts public so we can make this everything one
//The colours and thicknesses have to be altered and messed with

sma1 = sma(close, 10)
sma2 = sma(close, 20)
plot(sma1, title="SMA10", color = yellow, linewidth = 2)
plot(sma2, title="SMA20", color = orange, linewidth = 2)
sma3 = sma(close, 50)
sma4 = sma(close, 100)
sma5 = sma(close, 200)
plot(sma3, title="SMA50", color = white, linewidth = 2)
plot(sma4, title="SMA100", color = blue, linewidth = 2)
plot(sma5, title="SMA200", color = fuchsia, linewidth = 2)
plot(cross(sma1, sma2) ? sma1 : na, style = cross, color = red, linewidth = 4)

length = input(200, minval=1)
src = input(hlc3, title="Source")
mult = input(3.0, minval=0.001, maxval=50)
basis = vwma(src, length)
dev = mult * stdev(src, length)
upper_1= basis + (0.236*dev)
upper_2= basis + (0.382*dev)
upper_3= basis + (0.5*dev)
upper_4= basis + (0.618*dev)
upper_5= basis + (0.764*dev)
upper_6= basis + (1*dev)
lower_1= basis - (0.236*dev)
lower_2= basis - (0.382*dev)
lower_3= basis - (0.5*dev)
lower_4= basis - (0.618*dev)
lower_5= basis - (0.764*dev)
lower_6= basis - (1*dev)
plot(basis, color=fuchsia, linewidth=2)
p1 = plot(upper_1, color=white, linewidth=1, title="0.236")
p2 = plot(upper_2, color=white, linewidth=1, title="0.382")
p3 = plot(upper_3, color=white, linewidth=1, title="0.5")
p4 = plot(upper_4, color=white, linewidth=1, title="0.618")
p5 = plot(upper_5, color=white, linewidth=1, title="0.764")
p6 = plot(upper_6, color=red, linewidth=2, title="1")
p13 = plot(lower_1, color=white, linewidth=1, title="0.236")
p14 = plot(lower_2, color=white, linewidth=1, title="0.382")
p15 = plot(lower_3, color=white, linewidth=1, title="0.5")
p16 = plot(lower_4, color=white, linewidth=1, title="0.618")
p17 = plot(lower_5, color=white, linewidth=1, title="0.764")
p18 = plot(lower_6, color=green, linewidth=2, title="1")

window1 = input(title='lookback window 1:',  defval=8)
window2 = input(title='lookback window 2:',  defval=21)

top1 = valuewhen(high >= highest(high, window1), high, 0)
bot1 = valuewhen(low <= lowest(low, window1), low, 0)
top2 = valuewhen(high >= highest(high, window2), high, 0)
bot2 = valuewhen(low <= lowest(low, window2), low, 0)

t1 = plot(top1, color=top1 != top1[1] ? na : black)
b1 = plot(bot1, color=bot1 != bot1[1] ? na : black)
t2 = plot(top2, color=top2 != top2[1] ? na : black)
b2 = plot(bot2, color=bot2 != bot2[1] ? na : black)

fill(t1, t2, color=orange, transp=80)
fill(b1, b2, color=olive, transp=80)

//inputs
h_left = input(title="H left",  defval=10)
h_right = input(title="H right",  defval=10)
sample_period = input(title="Sample bars for % TZ",  defval=5000)
show_ptz = input(title="Show PTZ", type=bool, defval=true)
show_channel = input(title="Show channel", type=bool, defval=true)

h_left_low = lowest(h_left)
h_left_high = highest(h_left)
newlow = low <= h_left_low
newhigh = high >= h_left_high
plotshape(newlow and show_ptz, style=shape.triangledown, location=location.belowbar, color=red)
plotshape(newhigh and show_ptz, style=shape.triangleup, location=location.abovebar, color=green)
channel_high = plot(show_channel ? h_left_low : 0, color=silver)
channel_low = plot (show_channel ? h_left_high : 0, color=silver)

central_bar_low = low[h_right + 1]
central_bar_high = high[h_right + 1]
full_zone_low = lowest(h_left + h_right + 1)
full_zone_high = highest(h_left + h_right + 1)
central_bar_is_highest = central_bar_high >= full_zone_high
central_bar_is_lowest = central_bar_low <= full_zone_low
plotarrow(central_bar_is_highest ? -1 : 0, offset=-h_right-1)
plotarrow(central_bar_is_lowest ? 1 : 0, offset=-h_right-1)

x = central_bar_is_highest ? 1 : 0
high_bar_tz_count = cum(x)

y = central_bar_is_lowest ? 1 : 0
low_bar_tz_count = cum(y)

total_tz = high_bar_tz_count + low_bar_tz_count
percent_tz_high = (high_bar_tz_count / sample_period) * 100
//plot(percent_tz_high, color = lime, transp=100)
percent_tz_low = (low_bar_tz_count / sample_period) * 100
//plot(low_bar_tz_count, color=red, transp=100)
percent_total_tz = (percent_tz_high + percent_tz_low)
plot(percent_total_tz, color=black, transp=100)

//PTZ probability calc
i = newhigh ? 1 : 0
high_bar_ptz_count = cum(i)

j = newlow ? 1 : 0
low_bar_ptz_count = cum(j)

total_ptz = high_bar_ptz_count + low_bar_ptz_count
percent_ptz_high = (high_bar_ptz_count / sample_period) * 100
//plot(percent_ptz_high, color=green, transp=100)
percent_ptz_low = (low_bar_ptz_count / sample_period) * 100
//plot(percent_ptz_low, color=maroon, transp=100)
percent_total_ptz = (percent_ptz_high + percent_ptz_low)
plot(percent_total_ptz, color=navy,  transp=100)

//PTZ resolving probability calc
percent_ptz_resolved = (1 - (total_tz / total_ptz)) * 100
plot(percent_ptz_resolved, color=gray,  transp=100)


devUp1 = input(1.28, title="Stdev above (1)")
devDn1 = input(1.28, title="Stdev below (1)")

devUp2 = input(2.01, title="Stdev above (2)")
devDn2 = input(2.01, title="Stdev below (2)")

devUp3 = input(2.51, title="Stdev above (3)")
devDn3 = input(2.51, title="Stdev below (3)")

devUp4 = input(3.09, title="Stdev above (4)")
devDn4 = input(3.09, title="Stdev below (4)")

devUp5 = input(4.01, title="Stdev above (5)")
devDn5 = input(4.01, title="Stdev below (5)")
showBcol = input(true, title="Turn Barcolor ON/OFF?")
showDv2 = input(true, type=bool, title="Show second group of bands?")
showDv3 = input(true, type=bool, title="Show third group of bands?")
showDv4 = input(false, type=bool, title="Show fourth group of bands?")
showDv5 = input(false, type=bool, title="Show fifth group of bands?")

showPrevVWAP = input(false, type=bool, title="Show previous VWAP close")
ColorSrc=input(close)
price=ColorSrc
start = request.security(syminfo.tickerid, "W", time)

newSession = iff(change(start), 1, 0)

vwapsum = iff(newSession, hl2*volume, vwapsum[1]+hl2*volume)
volumesum = iff(newSession, volume, volumesum[1]+volume)
v2sum = iff(newSession, volume*hl2*hl2, v2sum[1]+volume*hl2*hl2)
myvwap = vwapsum/volumesum
dev9 = sqrt(max(v2sum/volumesum - myvwap*myvwap, 0))

A=plot(myvwap,style=circles, title="VWAP", color=black)
U1=plot(myvwap + devUp1 * dev9,style=circles, title="VWAP Upper", color=gray)
D1=plot(myvwap - devDn1 * dev9, style=circles, title="VWAP Lower", color=gray)

myvwapu1= myvwap + devUp1 * dev9
myvwapd1= myvwap - devDn1 * dev9

U2=plot(showDv2 ? myvwap + devUp2 * dev9 : na, color=red, title="VWAP Upper (2)")
D2=plot(showDv2 ? myvwap - devDn2 * dev9 : na, color=green, title="VWAP Lower (2)")

myvwapu2= myvwap + devUp2 * dev9
myvwapu3= myvwap + devUp3 * dev9
myvwapd2= myvwap - devDn2 * dev9
myvwapd3= myvwap - devDn3 * dev9

U3=plot(showDv3 ? myvwap + devUp3 * dev9 : na, title="VWAP Upper (3)", color=red)
D3=plot(showDv3 ? myvwap - devDn3 * dev9 : na, title="VWAP Lower (3)", color=green)

myvwapu4= myvwap + devDn4 * dev9
myvwapd4= myvwap - devDn4 * dev9

U4=plot(showDv4 ? myvwap + devUp4 * dev9 : na, title="VWAP Upper (4)", color=red)
D4=plot(showDv4 ? myvwap - devDn4 * dev9 : na, title="VWAP Lower (4)", color=green)

U5=plot(showDv5 ? myvwap + devUp5 * dev9 : na, title="VWAP Upper (5)", color=red)
D5=plot(showDv5 ? myvwap - devDn5 * dev9 : na, title="VWAP Lower (5)", color=green)

prevwap = iff(newSession, myvwap[1], prevwap[1])

plot(showPrevVWAP ? prevwap : na, style=circles, color=close > prevwap ? green : red)

ColorMiddleU = price > myvwap and price < myvwapu2 ? white:na
ColorMiddleD = price > myvwapd1 and price < myvwap ? black:na

ColorDv1d = price > myvwapd2 and price < myvwapd1 ? gray:na
ColorDv1u = price > myvwapu1 and price < myvwapu2 ? gray:na

ColorDv2d = price > myvwapd3 and price < myvwapd2 ? green:na
ColorDv2u = price > myvwapu2 and price < myvwapu3 ? maroon:na

ColorDv3d = price > myvwapd4 and price < myvwapd3 ? lime:na
ColorDv3u = price > myvwapu3 and price < myvwapu4 ? red:na

barcolor(showBcol?ColorMiddleD:na, title="BarColor vwap-1 Lower")
barcolor(showBcol?ColorMiddleU:na, title="BarColorColor vwap-1 upper")
barcolor(showBcol?ColorDv1d:na, title="BarColor 1-2 Lower")
barcolor(showBcol?ColorDv1u:na, title="BarColorColor 1-2 upper")
barcolor(showBcol?ColorDv2d:na, title="BarColor 2-3 Lower")
barcolor(showBcol?ColorDv2u:na, title="BarColorColor 2-3 upper")
barcolor(showBcol?ColorDv3d:na, title="BarColor 3-4 Lower")
barcolor(showBcol?ColorDv3u:na, title="BarColorColor 3-4 upper")

fill(U1, U2, color=red, transp=90, title="Over Bought Fill 1")
fill(D1, D2, color=green, transp=90, title="Over Sold Fill 1")
fill(U2, U3, color=red, transp=90, title="Over Bought Fill 2")
fill(D2, D3, color=green, transp=90, title="Over Sold Fill 2")
fill(U3, U4, color=red, transp=90, title="Over Bought Fill 3")
fill(D3, D4, color=green, transp=90, title="Over Sold Fill 3")
fill(U4, U5, color=red, transp=90, title="Over Bought Fill 4")
fill(D4, D5, color=green, transp=90, title="Over Sold Fill 4")
fill(A, U1, color=gray, transp=90, title="Middle Fill Up")
fill(A, D1, color=gray, transp=90, title="Middle Fill Down")

//Created By ChrisMoody on 7/25/2014
//Simply Enhances Default Parabolic SAR by creating Two Color Options, One for UpTrend, Other for DownTrend
//Ability To Turn On/Off The Up Trending Parabolic SAR, And The Down Trending Parabolic SARstudy(title="CM_Parabolic SAR", shorttitle="CM_P-SAR", overlay=true)
start1 = input(2, minval=0, maxval=10, title="Start1 - Default = 2 - Multiplied by .01")
increment = input(2, minval=0, maxval=10, title="Step Setting (Sensitivity) - Default = 2 - Multiplied by .01" )
maximum = input(2, minval=1, maxval=10, title="Maximum Step (Sensitivity) - Default = 2 - Multiplied by .10")
sus = input(true, "Show Up Trending Parabolic Sar")
sds = input(true, "Show Down Trending Parabolic Sar")
disc = input(false, title="Start1 and Step settings are *.01 so 2 = .02 etc, Maximum Step is *.10 so 2 = .2")

startCalc = start1 * .01
incrementCalc = increment * .01
maximumCalc = maximum * .10

sarUp = sar(startCalc, incrementCalc, maximumCalc)
sarDown = sar(startCalc, incrementCalc, maximumCalc)

colUp = close >= sarDown ? lime : na
colDown = close <= sarUp ? red : na

plot(sus and sarUp ? sarUp : na, title="Up Trending SAR", style=circles, linewidth=4,color=colUp)
plot(sds and sarDown ? sarDown : na, title="Up Trending SAR", style=circles, linewidth=4,color=colDown)

TurtleSpeed = input(6, minval=1)

FastSpeed = highest(TurtleSpeed)
SlowSpeed = lowest(TurtleSpeed)

enterLong = high > FastSpeed[1]
enterShort = low < SlowSpeed[1]

strategy.entry("Long", strategy.long, when = enterLong)
strategy.entry("Short", strategy.short, when = enterShort)


More