Triple SuperTrend and Stoch RSI Strategy

Overview
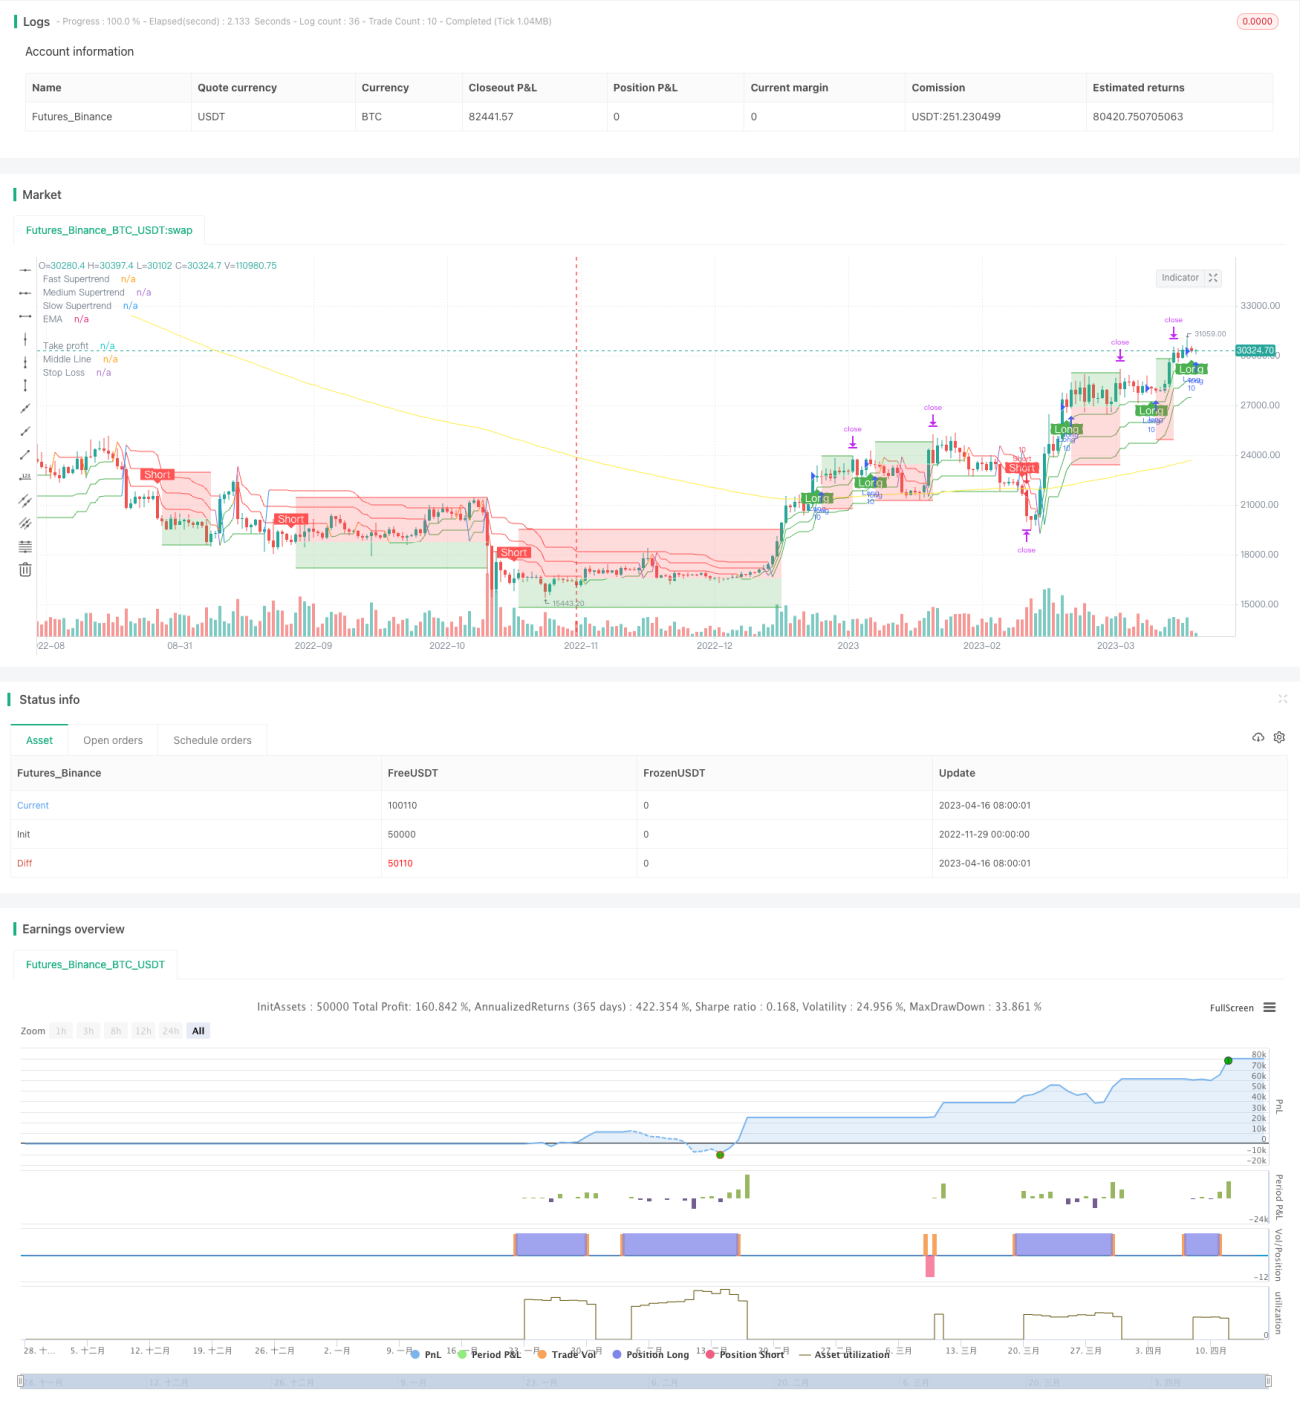
The Triple SuperTrend and Stoch RSI strategy is a quantitative trading strategy that combines multi-timeframe trend following of the SuperTrend indicator and overbought/oversold signals from the Stoch RSI indicator. The strategy utilizes three SuperTrend indicators with different parameter settings to determine market trends and combines Stoch RSI signals to filter trade signals. Specifically, when the two faster SuperTrend indicators give concurrent buy/sell signals, if the Stoch RSI indicator confirms, corresponding long/short positions will be taken.
Strategy Logic
The core logic of the Triple SuperTrend and Stoch RSI strategy is to combine SuperTrend indicators with different parameters and the Stoch RSI indicator for trade signal filtering to improve signal quality and decrease false signals.
Firstly, the strategy adopts three SuperTrend indicators with varied parameter settings to determine the major market trend. The three SuperTrend indicators have parameters ranging from fast to slow timeframes, in order to capture trend changes at different levels. When the fastest and second-fastest SuperTrend indicators give concurrent buy/sell signals, we make a preliminary judgment that the signal has some reliability.
Secondly, the Stoch RSI indicator is introduced to determine whether the market is extremely overbought or oversold when the signal occurs. The Stoch RSI indicator combines the strengths of the RSI and Stochastic indicators, enabling effective judgments on overbought/oversold market conditions. When the fastest and second fastest SuperTrend signals align with Stoch RSI signals, the final buy/sell signals can be triggered.
Through the combination of multiple indicators and timeframes, the Triple SuperTrend and Stoch RSI strategy can effectively filter out market noise, improve signal reliability, and reduce incorrect trades.
Advantages of the Strategy
The biggest advantage of the Triple SuperTrend and Stoch RSI strategy lies in the effective combination of multiple indicators and timeframes, which brings the following benefits:
-
Reduces incorrect trade signals. The combination of the triple SuperTrend and Stoch RSI indicators can greatly decrease noise and false signals that come with individual indicators.
-
Improves profitable signal ratio. Despite decreased signal frequency, the proportion of profitable signals sees significant improvement.
-
Suitable for trending markets. Multi-timeframe filtering facilitates capturing medium- to long-term trends, fitting trending market environments well.
-
Easy optimization for better performance. The triple indicators allow wider possibilities for parameter optimization.
-
Customizable parameters catering to personal trading style. The parameters can be freely adjusted to better suit one's own trading style.
Risks of the Strategy
There are also some risks associated with the Triple SuperTrend and Stoch RSI strategy:
-
Decreased signal frequency. The multilayer filter mechanism significantly decreases the trading frequency of the strategy.
-
Prone to missing some potential signals. The conservative nature makes the strategy likely to miss some profitable opportunities.
-
Increased parameter dependence. More indicators means greater difficulty in optimization.
-
Limited trend following capability. The multi-timeframe combination also constrains the flexibility of trend following of the strategy.
To address these risks, optimization measures like adjusting indicator parameters and introducing more supplemental indicators can be adopted to enhance risk control while improving profitability quality.
Optimization Directions
There is still room for further optimization of the Triple SuperTrend and Stoch RSI strategy:
-
Adjust indicator parameters for best combination. More sets of parameters can be tested to find the optimum.
-
Introduce stop loss/take profit for better risk control. This can greatly improve the stability of the strategy.
-
Incorporate more indicators for signal validation, e.g. volume indicators.
-
Build in adaptive capabilities to auto optimize parameters according to changing market dynamics.
-
Combine machine learning algorithms for performance prediction, assessing signal accuracy.
With continuous optimization, the Triple SuperTrend and Stoch RSI strategy can evolve into a stable, efficient trading system, providing considerable alpha.
Conclusion
The Triple SuperTrend and Stoch RSI strategy successfully combines multi-timeframe analysis and overbought/oversold judgment into a unique trend following trading strategy. It retains the dual advantages of trend following and indicator filtering, improving profitable signals while decreasing false signals. Although risks and optimization space still exist, its profitability and stability can be further enhanced through parameter tuning and strategy optimization. Overall, the Triple SuperTrend and Stoch RSI strategy provides a high-quality quantitative trading strategy choice.
- 1