概述
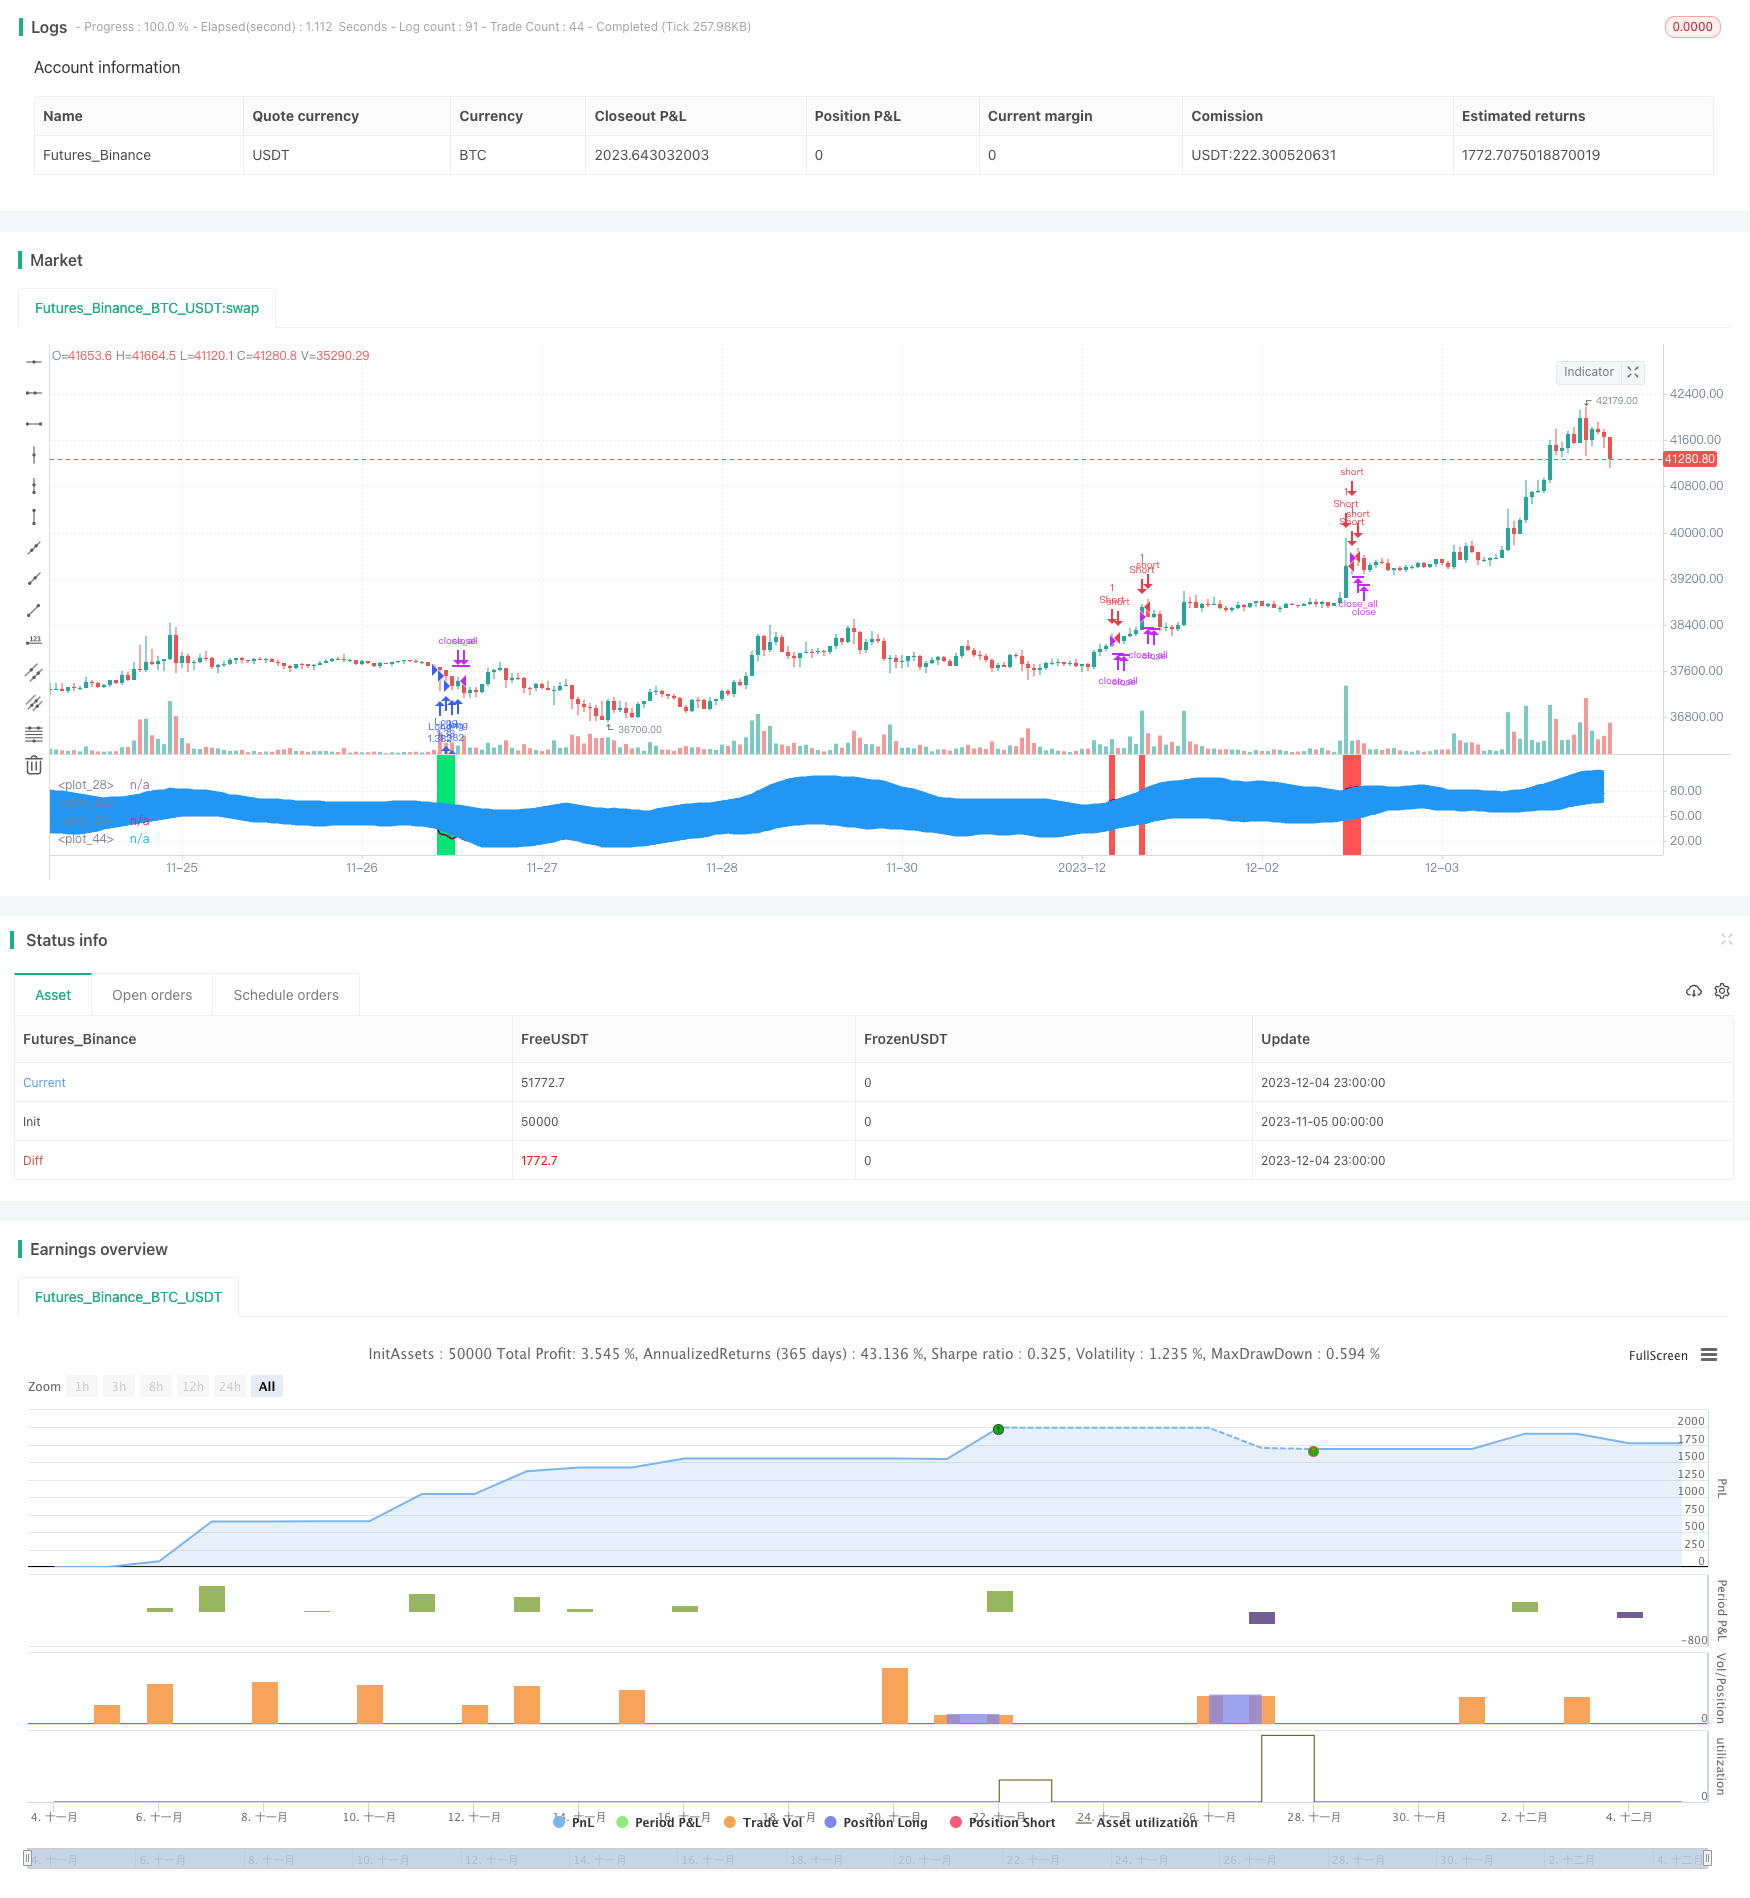
该策略基于布林带百分比指标结合RSI和MFI指标,通过检测金融产品价格突破布林带上下轨,结合RSI过卖超买和MFI超卖超买信号,制定做多做空决策。是一个典型的去趋势交易策略。
策略原理
- 计算布林带百分比(BB%)。BB%表示价格相对布林带中轨的标准差,通过布林带通道判断市场方向。
- 结合RSI和MFI指标判断超买超卖。RSI通过比较一段时间内的平均涨幅和平均跌幅,判断超买超卖。MFI通过比较上涨交易量和下跌交易量,判断超买超卖。
- 当价格从下向上突破布林带下轨时,做多;当价格从上向下突破布林带上轨时,做空。同时结合RSI和MFI指标的超卖超买信号过滤。
策略优势
- 去趋势交易,避开市场走势,降低收益波动。
- 结合多个指标过滤信号,提高决策准确性。
- Parameter化设置灵活,可调整策略风险收益特征。
- 适用于大宗商品、外汇、加密货币等高波动标的。
风险及解决
- 布林带突破产生假信号的概率较大,需要多个指标组合过滤。
- 突破信号判断需要适当放宽,避免漏失良好机会。
- 调整参数设置控制风险,如调整仓位规模,升高止损线等。
优化方向
- 增加基于波动率的止损机制,如ATR指标。
- 引入机器学习模型辅助判断突破信号质量。
- 优化参与品种选择机制,动态调整参与标的。
- 结合情绪指标、消息面等更多因素完善决策体系。
总结
该策略主要应用于高波动的非趋势性品种,通过布林带通道与指标组合判断,实现去趋势交易。可通过调整参数控制风险收益特征。后续可引入更多辅助指标和模型优化决策质量,从而获得更好的策略表现。
策略源码
/*backtest
start: 2023-11-05 00:00:00
end: 2023-12-05 00:00:00
period: 1h
basePeriod: 15m
exchanges: [{"eid":"Futures_Binance","currency":"BTC_USDT"}]
*/

//Noro
//2018

//@version=2
strategy(title = "BB%/MFI/RSI", shorttitle = "BB%/MFI/RSI", default_qty_type = strategy.percent_of_equity, default_qty_value = 100, pyramiding = 100)

//Settings
needlong = input(true, defval = true, title = "Long")
needshort = input(false, defval = false, title = "Short")
capital = input(100, defval = 100, minval = 1, maxval = 10000, title = "Lot, %")
fromyear = input(1900, defval = 1900, minval = 1900, maxval = 2100, title = "From Year")
toyear = input(2100, defval = 2100, minval = 1900, maxval = 2100, title = "To Year")
frommonth = input(01, defval = 01, minval = 01, maxval = 12, title = "From Month")
tomonth = input(12, defval = 12, minval = 01, maxval = 12, title = "To Month")
fromday = input(01, defval = 01, minval = 01, maxval = 31, title = "From Day")
today = input(31, defval = 31, minval = 01, maxval = 31, title = "To Day")

source = hlc3
length = input(14, minval=1), mult = input(2.0, minval=0.001, maxval=50), bblength = input(50, minval=1, title="BB Period")
DrawRSI_f=input(true, title="Draw RSI?", type=bool)
DrawMFI_f=input(false, title="Draw MFI?", type=bool)
HighlightBreaches=input(true, title="Highlight Oversold/Overbought?", type=bool)

DrawMFI = (not DrawMFI_f) and (not DrawRSI_f) ? true : DrawMFI_f
DrawRSI = (DrawMFI_f and DrawRSI_f) ? false : DrawRSI_f
// RSI
rsi_s = DrawRSI ? rsi(source, length) : na
plot(DrawRSI ? rsi_s : na, color=maroon, linewidth=2)

// MFI
upper_s = DrawMFI ? sum(volume * (change(source) <= 0 ? 0 : source), length) : na
lower_s = DrawMFI ? sum(volume * (change(source) >= 0 ? 0 : source), length) : na
mf = DrawMFI ? rsi(upper_s, lower_s) : na
plot(DrawMFI ? mf : na, color=green, linewidth=2)

// Draw BB on indices
bb_s = DrawRSI ? rsi_s : DrawMFI ? mf : na
basis = sma(bb_s, length)
dev = mult * stdev(bb_s, bblength)
upper = basis + dev
lower = basis - dev
plot(basis, color=red)
p1 = plot(upper, color=blue)
p2 = plot(lower, color=blue)
fill(p1,p2, blue)

b_color = (bb_s > upper) ? red : (bb_s < lower) ? lime : na
bgcolor(HighlightBreaches ? b_color : na, transp = 0)

//Signals
up = bb_s < lower and close < open
dn = bb_s > upper and close > open
size = strategy.position_size
lp = size > 0 and close > open
sp = size < 0 and close < open
exit = (up == false and dn == false) and (lp or sp)

//Trading
lot = strategy.position_size == 0 ? strategy.equity / close * capital / 100 : lot[1]
if up
    if strategy.position_size < 0
        strategy.close_all()

    strategy.entry("Long", strategy.long, needlong == false ? 0 : lot, when=(time > timestamp(fromyear, frommonth, fromday, 00, 00) and time < timestamp(toyear, tomonth, today, 23, 59)))

if dn
    if strategy.position_size > 0
        strategy.close_all()

    strategy.entry("Short", strategy.short, needshort == false ? 0 : lot, when=(time > timestamp(fromyear, frommonth, fromday, 00, 00) and time < timestamp(toyear, tomonth, today, 23, 59)))

if time > timestamp(toyear, tomonth, today, 23, 59) or exit
    strategy.close_all()