Multi Moving Average Crossover Trading Strategy

Author: ChaoZhang, Date: 2023-12-06 17:10:00
Tags:

img

Strategy Overview

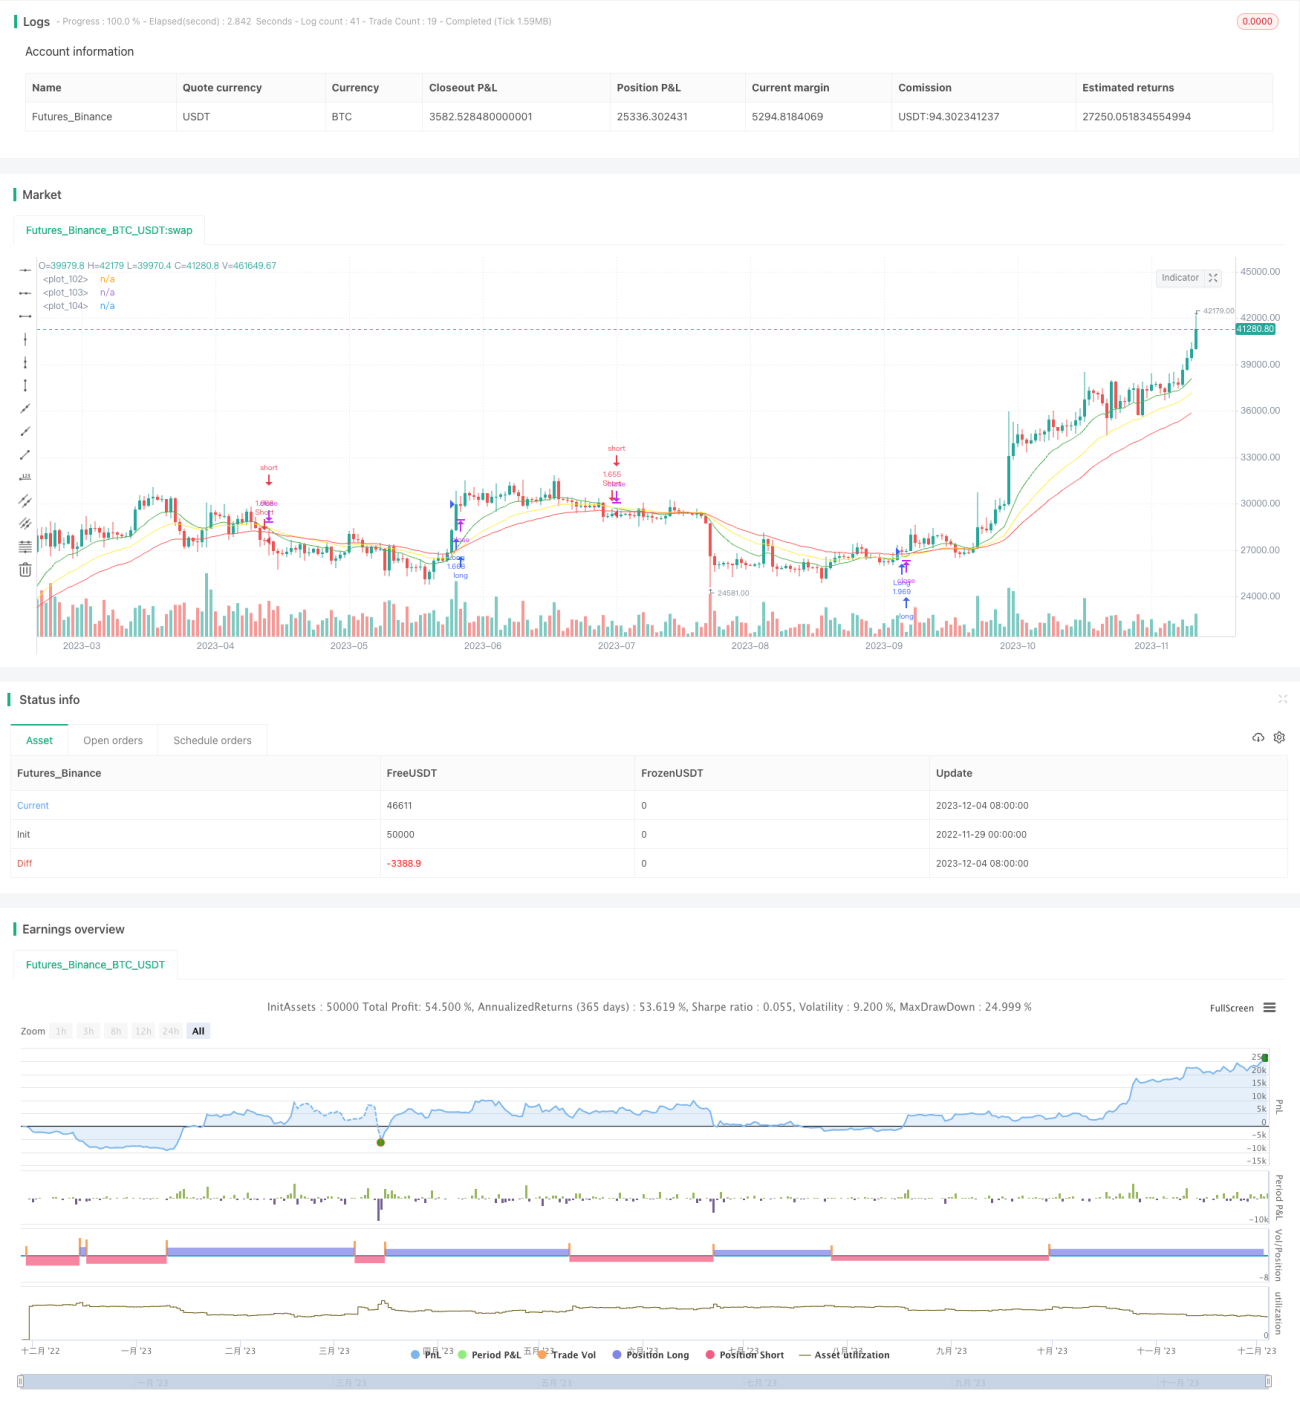
This strategy generates trading signals based on multiple moving average indicators. It monitors short-term, medium-term and long-term moving averages simultaneously, and generates trading signals according to their crossover situations to determine trend direction.

Strategy Name

Multi Moving Average Crossover Strategy

Strategy Logic

This strategy employs 3 moving averages with different periods, including 7-day, 13-day and 21-day lines. The trading logic is based on the following points:

  1. When the short-term 7-day MA crosses over the medium-term 13-day MA upwards, while the long-term 21-day MA is in an upward trend, a long signal is generated.
  2. When the short-term 7-day MA crosses below the medium-term 13-day MA downwards, while the long-term 21-day MA is in a downward trend, a short signal is generated.

By combining moving averages across different timeframes, the strategy can judge market trends more precisely and avoid false trades.

Advantages

  1. Using multiple MA lines can better determine market moves and avoid being misguided by false breakouts or short-term fluctuations in the market.
  2. Signals are only generated when the trend is clear, thus reducing unnecessary trades and lowering transaction costs.
  3. Flexible parameter settings - the periods of the MAs can be adjusted based on personal preference to suit different products and market environments.

Risks

  1. Frequent false signals may occur in a ranging, choppy market.
  2. MAs as trend-following indicators cannot accurately locate turning points.
  3. Delayed signal by MA crossovers may miss part of the profits.
  4. Risks can be reduced by introducing other technical indicators for signal validation and optimizing MA parameters.

Optimization Directions

  1. Consider incorporating volatility indicators to gauge trend strength and avoid trading in choppy markets.
  2. Try applying machine learning models to auto-optimize MA parameters.
  3. Add stop loss strategies to cut losses in time when drawdowns expand.
  4. Use limit orders when MA crossover happens to reduce slippage.

Conclusion

This strategy combines short-term, medium-term and long-term MAs to determine market trend based on their crossover relations, making it a relatively stable and efficient trend-following strategy. Further improvements in indicator parameters, stop loss mechanisms and order placement can help increase win rate and profitability.


/*backtest
start: 2022-11-29 00:00:00
end: 2023-12-05 00:00:00
period: 1d
basePeriod: 1h
exchanges: [{"eid":"Futures_Binance","currency":"BTC_USDT"}]
*/

// This source code is subject to the terms of the Mozilla Public License 2.0 at https://mozilla.org/MPL/2.0/
// © Crypto-Oli

//@version=4
strategy("CryptOli 3 MAs long/short Backtest", initial_capital=5000, default_qty_type=strategy.percent_of_equity, default_qty_value=100, overlay=true)

// this is an educational Script - basicly its very simple - you can see how minimal changes impact results, thats why i posted it
// Credits to Quantnomad to publish tons of free educational script
// this Script is based on https://www.tradingview.com/script/0NgUadGr-Ultimate-MA-Cross-Indicator/ Quantnomads Ultimate MA Indicator 
// HA - Option for calcucaltion based on HA-Candles (very famous recently)
// Source Input - Option (Candletype for calculation, close, ohlc4 ect.) --- there are huge differences --- try it by your own

////////////////////////////////////////////////////////////////////////////////
// BACKTESTING RANGE

// From Date Inputs
fromDay = input(defval=1, title="From Day", minval=1, maxval=31)
fromMonth = input(defval=1, title="From Month", minval=1, maxval=12)
fromYear = input(defval=2015, title="From Year", minval=1970)

// To Date Inputs
toDay = input(defval=1, title="To Day", minval=1, maxval=31)
toMonth = input(defval=1, title="To Month", minval=1, maxval=12)
toYear = input(defval=2030, title="To Year", minval=1970)

// Calculate start/end date and time condition
startDate = timestamp(fromYear, fromMonth, fromDay, 00, 00)
finishDate = timestamp(toYear, toMonth, toDay, 00, 00)
time_cond = time >= startDate and time <= finishDate

////////////////////////////////////////////////////////////////////////////////

h = input(false, title = "Signals from Heikin Ashi Candles")

ma_type      = input(title = "MA Type",         type = input.string,  defval = "SMMA", options = ['SMA', 'EMA', 'WMA', 'VWMA', 'HMA', 'SMMA', 'DEMA'])
src = input(ohlc4)

short_ma_len = input(title = "Short MA Length", type = input.integer, defval = 7,     minval = 1)
short_ma_src = h ? security(heikinashi(syminfo.tickerid), timeframe.period, src, lookahead = false) : close
middle_ma_len  = input(title = "Middle MA Length",  type = input.integer, defval = 13,    minval = 2)
middle_ma_src = h ? security(heikinashi(syminfo.tickerid), timeframe.period, src, lookahead = false) : close
long_ma_len  = input(title = "Long MA Length",  type = input.integer, defval = 21,    minval = 2)
long_ma_src = h ? security(heikinashi(syminfo.tickerid), timeframe.period, src, lookahead = false) : close


tick_round(x) => 
    round(x / syminfo.mintick) * syminfo.mintick

// Set initial values to 0
short_ma = 0.0
middle_ma = 0.0
long_ma  = 0.0

// Simple Moving Average (SMA)
if ma_type == 'SMA' 
    short_ma := sma(short_ma_src, short_ma_len)
    middle_ma := sma(middle_ma_src, middle_ma_len)
    long_ma  := sma(long_ma_src,  long_ma_len)

// Exponential Moving Average (EMA)
if ma_type == 'EMA'
    short_ma := ema(short_ma_src, short_ma_len)
    middle_ma := ema(middle_ma_src, middle_ma_len)
    long_ma  := ema(long_ma_src,  long_ma_len)

// Weighted Moving Average (WMA)
if ma_type == 'WMA'
    short_ma := wma(short_ma_src, short_ma_len)
    middle_ma := wma(middle_ma_src, middle_ma_len)
    long_ma  := wma(long_ma_src,  long_ma_len)

// Hull Moving Average (HMA)
if ma_type == 'HMA'
    short_ma := wma(2*wma(short_ma_src, short_ma_len/2)-wma(short_ma_src, short_ma_len), round(sqrt(short_ma_len)))
    middle_ma := wma(2*wma(middle_ma_src, middle_ma_len/2)-wma(middle_ma_src, middle_ma_len), round(sqrt(middle_ma_len)))
    long_ma  := wma(2*wma(long_ma_src,  long_ma_len /2)-wma(long_ma_src,  long_ma_len),  round(sqrt(long_ma_len)))

// Volume-weighted Moving Average (VWMA)
if ma_type == 'VWMA'
    short_ma := vwma(short_ma_src, short_ma_len)
    middle_ma := vwma(middle_ma_src, middle_ma_len)
    long_ma  := vwma(long_ma_src,  long_ma_len)


// Smoothed Moving Average (SMMA)    
if ma_type == 'SMMA'
    short_ma := na(short_ma[1]) ? sma(short_ma_src, short_ma_len) : (short_ma[1] * (short_ma_len - 1) + short_ma_src) / short_ma_len
    middle_ma := na(middle_ma[1]) ? sma(middle_ma_src, middle_ma_len) : (middle_ma[1] * (middle_ma_len - 1) + middle_ma_src) / middle_ma_len
    long_ma  := na(long_ma[1])  ? sma(long_ma_src,  long_ma_len)  : (long_ma[1]  * (long_ma_len  - 1) + long_ma_src)  / long_ma_len

// Double Exponential Moving Average (DEMA)
if ma_type == 'DEMA'
    e1_short = ema(short_ma_src, short_ma_len)
    e1_middle = ema(middle_ma_src, middle_ma_len)
    e1_long  = ema(long_ma_src,  long_ma_len)
    
    short_ma := 2 * e1_short - ema(e1_short, short_ma_len)
    middle_ma := 2 * e1_middle - ema(e1_middle, middle_ma_len)
    long_ma  := 2 * e1_long  - ema(e1_long,  long_ma_len)

// Plot MAs
plot(short_ma, color = color.green,   linewidth = 1)
plot(middle_ma, color = color.yellow,   linewidth = 1)
plot(long_ma,  color = color.red, linewidth = 1)

if close>long_ma and short_ma>middle_ma and time_cond
    strategy.entry("Long", strategy.long)


if close<long_ma and short_ma<middle_ma and time_cond
    strategy.entry("Short", strategy.short)


More