RSI Based Quantitative Trading Strategy

Overview
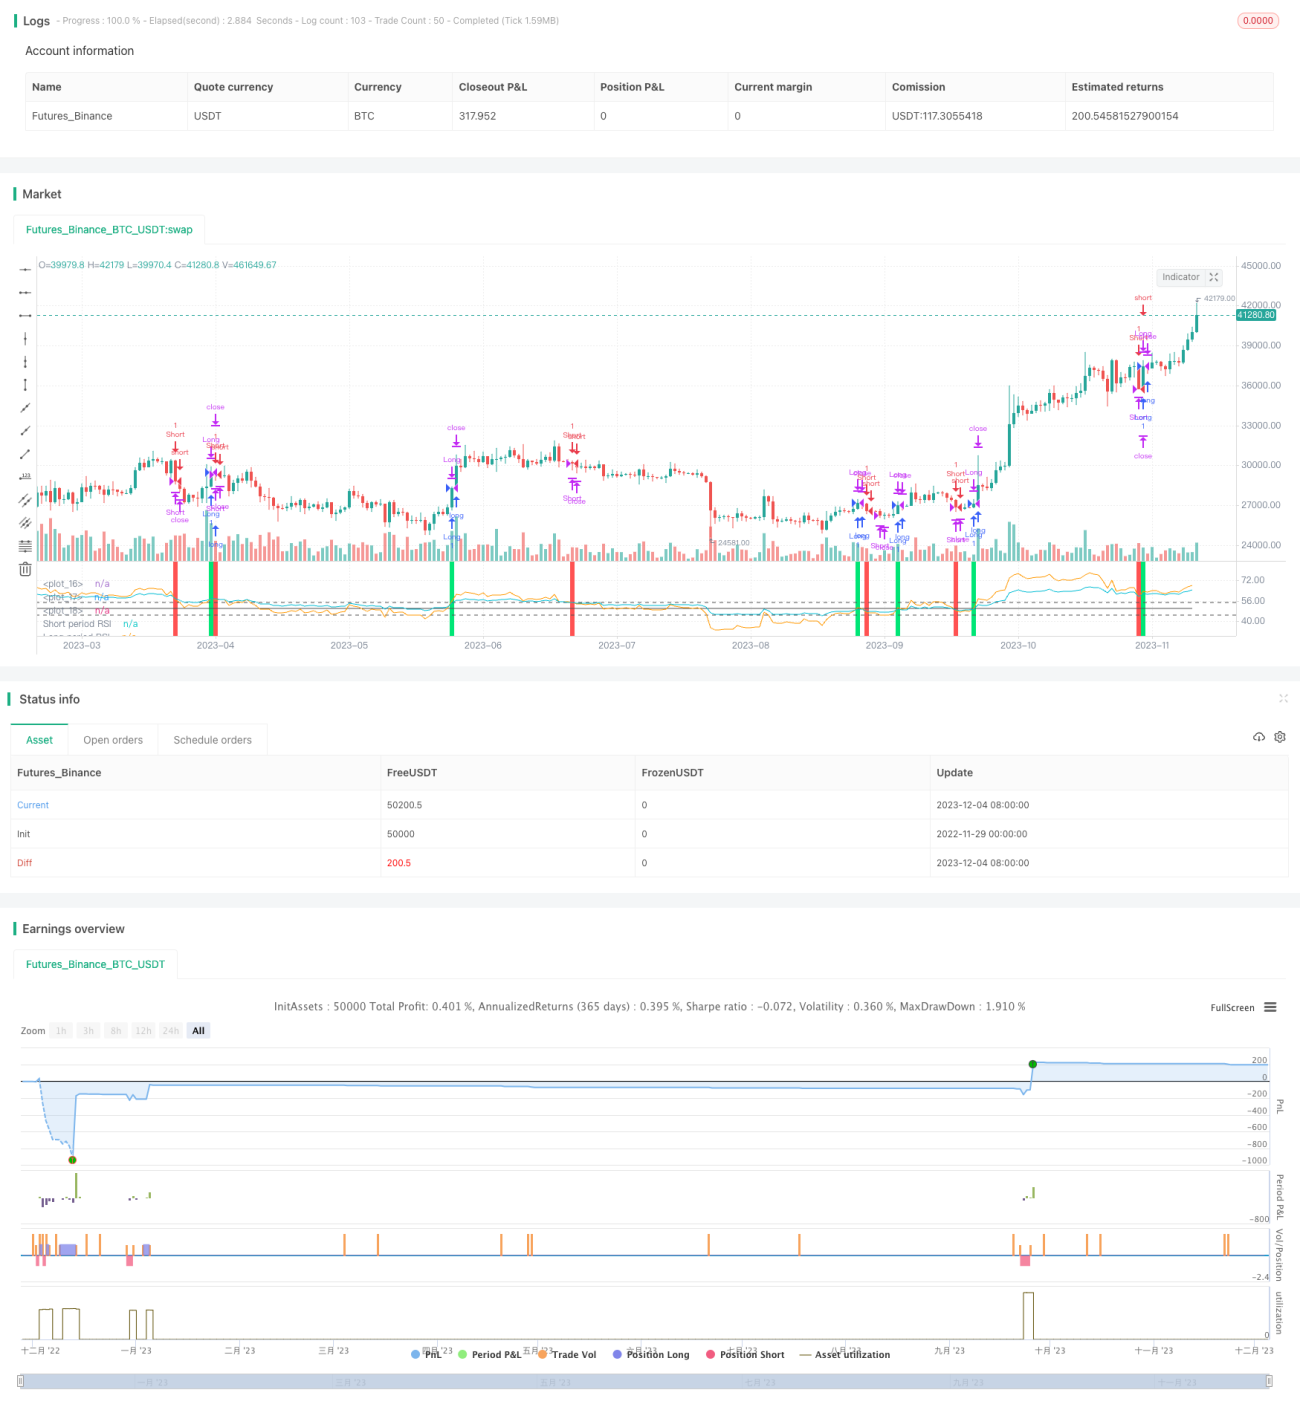
The strategy is named "Dual Timeframe RSI Reversal". It is a quantitative trading strategy based on Relative Strength Index (RSI). The strategy uses two RSI with different periods to generate buy and sell signals, aiming to buy low and sell high by capturing price reversal opportunities.
Strategy Logic
The strategy constructs trading signals by comparing a fast period RSI (default 55 days) and a slow period RSI (default 126 days). When the fast RSI crosses above the slow RSI, a buy signal is generated. When the fast RSI falls below the slow RSI, a sell signal is triggered. By comparing the relative strength between two different timeframes, it detects opportunities when short-term and long-term trends reversing.
After entering a position, profit target and stop loss will be set. Default profit target is 0.9 times the entry price. Default stop loss is 3% below the entry price. Positions will also be closed if a reverse signal is triggered.
Advantages
- Catch short-term price reversals by comparing dual RSIs
- Filter out false signals using dual confirmation
- Limit loss on single bet with stop loss
Risks
- Frequent reverse signals during high volatility
- Stop loss too tight, easily knocked out by small fluctuations
- Miss major reversals with poorly configured parameters
Enhancement
- Test more RSI parameter combinations to find optimum
- Add other indicators to filter false signals
- Dynamic stop loss and take profit ratio for better profitability
Summary
The "Dual Timeframe RSI Reversal" strategy generates trading signals by comparing crossovers between fast and slow RSI periods. It aims to capture short-term price reversals. Profit and stop loss rules are set to limit risks. This is a typical strategy of using multi-timeframe indicator comparisons to trade reversals. Enhancement areas include parameter tuning and risk control rules.
/*backtest
start: 2022-11-29 00:00:00
end: 2023-12-05 00:00:00
period: 1d
basePeriod: 1h
exchanges: [{"eid":"Futures_Binance","currency":"BTC_USDT"}]
*/

//@version=2
strategy(title="Relative Strength Index", shorttitle="RSI")
slen    = input(55, title="Short length")
llen = input(126, title="Long length")- 1