Trend Following Strategy with EMA

Overview
The name of this strategy is “Trend Following with EMA”, which is a quantitative trading strategy based on trend following and exponential moving average (EMA) technical indicators. It combines trend tracking and EMA to identify the price trend of stocks or other financial products, and makes buy and sell decisions accordingly.
Strategy Logic
The main logic of this strategy is:
-
Use the crossover between the 180-period low and close price to determine the upward trend. When the low crosses above the close price, it indicates the price starts to rise and a trend is formed, a long position will be opened at this point;
-
When the price changes from a downward trend to an upward trend, that is, the close price crosses above the open price and the EMA line is below, a long position will also be opened;
-
When the price changes from an upward trend to a downward trend, that is, the close price crosses below the open price, the existing long position will be closed;
-
Use the crossover between the 180-period high and EMA to determine the downward trend. When the high crosses below the EMA and the high is lower than the EMA, a short position will be opened;
-
When the price changes from an upward trend to a downward trend, that is, the close price crosses below the open price and the EMA line is above, a short position will also be opened;
-
When the price changes from a downward trend to an upward trend, that is, the close price crosses above the open price, the existing short position will be closed.
Advantage Analysis
This strategy combines trend following and moving average indicators, which can effectively capture the turning points of price trends. The advantages are:
- The trend following part can determine the direction of the price trend and reduce the probability of wrong operations;
- The moving average part can effectively filter out small price fluctuations and identify larger amplitude trends;
- Combining the two indicators can improve the reliability of trading signals and avoid false positives;
- The parameter settings are reasonable and flexible to adapt to different products and trading styles.
Risk Analysis
This strategy also has some risks:
- In scenarios of violent price fluctuations, there will be a lag in the EMA, which may miss the best entry point;
- Trend judging indicators are sensitive to parameters. Different cycle settings will lead to different trading signals and returns;
- The switching frequency of long and short positions may be too high, increasing slippage and commission costs.
The solutions to the risks are:
- Optimize the cycle parameter of the EMA to reduce the lag probability;
- Conduct parameter optimization to find the most suitable cycle parameters for the product;
- Set stop loss and take profit conditions to avoid excessively frequent position switching.
Optimization Directions
The strategy can be optimized in the following aspects:
- Add a position management module based on volatility to dynamically adjust positions according to market volatility;
- Add machine learning models to judge price trends, replacing simple crossover judgments to improve accuracy;
- Refine trading signals by incorporating fundamentals data to avoid wrong signals when company performance changes;
- Conduct multi-product parameter optimization to find the best parameter combination for cycles and improve stability and maximize returns.
Conclusion
In general, this is a typical trend following strategy that uses the characteristics of price itself to determine direction and track trends. It is simple, effective, easy to implement, and suitable as a beginner quantitative trading strategy. However, there are some problems like indicator lag and parameter sensitivity. These issues can be improved by introducing more data sources and using machine learning. So there is great potential for expansion and optimization of this strategy. It is a recommended high-frequency quantitative trading strategy.
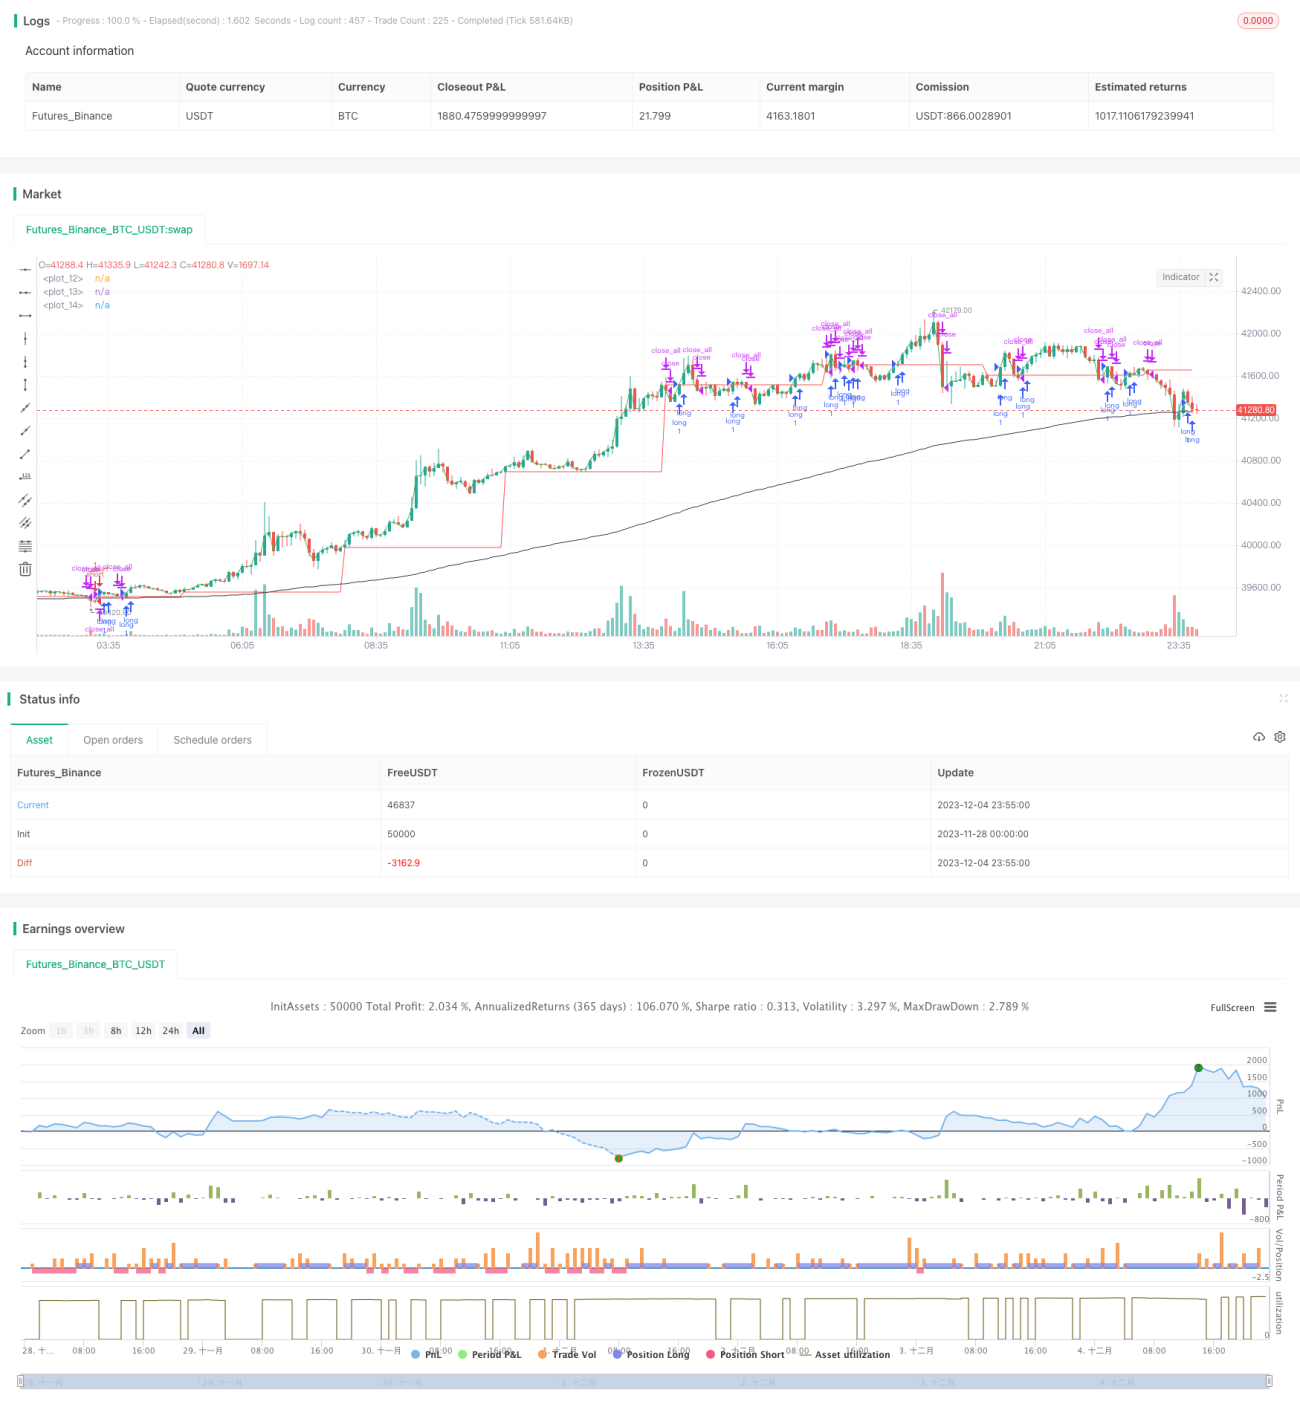
/*backtest
start: 2023-11-28 00:00:00
end: 2023-12-05 00:00:00
period: 5m
basePeriod: 1m
exchanges: [{"eid":"Futures_Binance","currency":"BTC_USDT"}]
*/

//@version=2
strategy("Trend + EMA", overlay=true, initial_capital=10000, currency=currency.USD, pyramiding=0)

tim=input("180", title="Period for trend")- 1