Dual Indicator Filtered Buy Signal Strategy

Author: ChaoZhang, Date: 2023-12-07 10:43:01
Tags:

img

Overview

The Dual Indicator Filtered Buy Signal strategy utilizes a combination of Stochastic RSI and Bollinger Bands to identify potential buy opportunities. It employs multiple filter conditions to distinguish the most favorable buy points. This allows it to identify high-probability buy entry timing in fluctuating market environments.

Strategy Logic

The strategy leverages two sets of indicators to spot buy chances.

Firstly, it uses Stochastic RSI to determine if the market is oversold. The indicator combines Stochastic and its moving average lines, treating a %K line crossover above its %D line from below as an oversold signal. A threshold is set here so that %K values above 20 are considered oversold.

Secondly, the strategy employs Bollinger Bands to identify price changes. Bollinger Bands are bands calculated from the standard deviation of prices. When prices approach the lower band, it signals an oversold condition. The strategy here sets the parameter to 2 times standard deviation for wider Bollinger Bands, filtering out more false signals.

With oversold signals obtained from both indicators, the strategy adds multiple filter conditions to further identify buy entry timing:

  1. Price just bounced off the Bollinger lower band upwards
  2. Current close is higher than the close N bars ago, showing buying power
  3. Current close is lower than longer-term or mid-term lookback period closes for pullback

Buy signals are triggered when the comprehensive criteria are met.

Strength Analysis

The dual indicator filtered strategy has several key strengths:

  1. The dual indicator design makes buy signals more reliable by avoiding false signals.
  2. Multiple filter conditions prevent excessive buys in range-bound markets.
  3. Combination of Stochastic RSI gauges oversold levels and Bollinger Bands detects price anomalies.
  4. Buying power filter ensures adequate momentum behind buys.
  5. Pullback filters further validate reliability of buy zones.

In summary, the strategy combines various technical indicators and filtering techniques to pinpoint buy entry timing more precisely, leading to better trading performance.

Risk Analysis

Despite its strengths, there are also risks to manage with the strategy:

  1. Improper parameter tuning may result in too frequent or conservative signals. Careful optimization is required.
  2. Strict filtering logics may miss some opportunities in fast-moving markets.
  3. Diverging indicators may generate false signals. Cross-examination is necessary.
  4. Lack of trend determination exposes the strategy during bear markets.

Suggested enhancements to mitigate the risks are:

  1. Adjust indicator parameters to balance filter sensitivity.
  2. Introduce trend-determining filters to avoid bull traps.
  3. Incorporate stop loss mechanisms.

Enhancement Opportunities

The strategy can be further improved in aspects below:

  1. Test more indicator combinations for better buy timing models, e.g. VRSI, DMI etc.
  2. Introduce machine learning algorithms to auto-optimize parameters.
  3. Build adaptive stop loss mechanisms to trail stops at profit milestones.
  4. Incorporate volume indicators to ensure sufficient momentum.
  5. Optimize money management models like dynamic position sizing to limit losses.

With more advanced techniques introduced, the strategy can achieve more precise signal generating capabilities and stronger risk control to deliver more reliable profits in live trading.

Conclusion

In summary, the Dual Indicator Filtered Buy Signal Strategy leverages Stochastic RSI, Bollinger Bands and multiple filter conditions like price strength and pullback validation to identify high-probability buy entry points. With proper parameter tuning, risk controls etc., it has the potential to become a stable automated trading strategy.

Its core strength lies in the effective combination of indicators and filters for accurate timing. The risks and enhancement paths are also identifiable and manageable. Overall, this is an implementable and effective quantitative strategy.
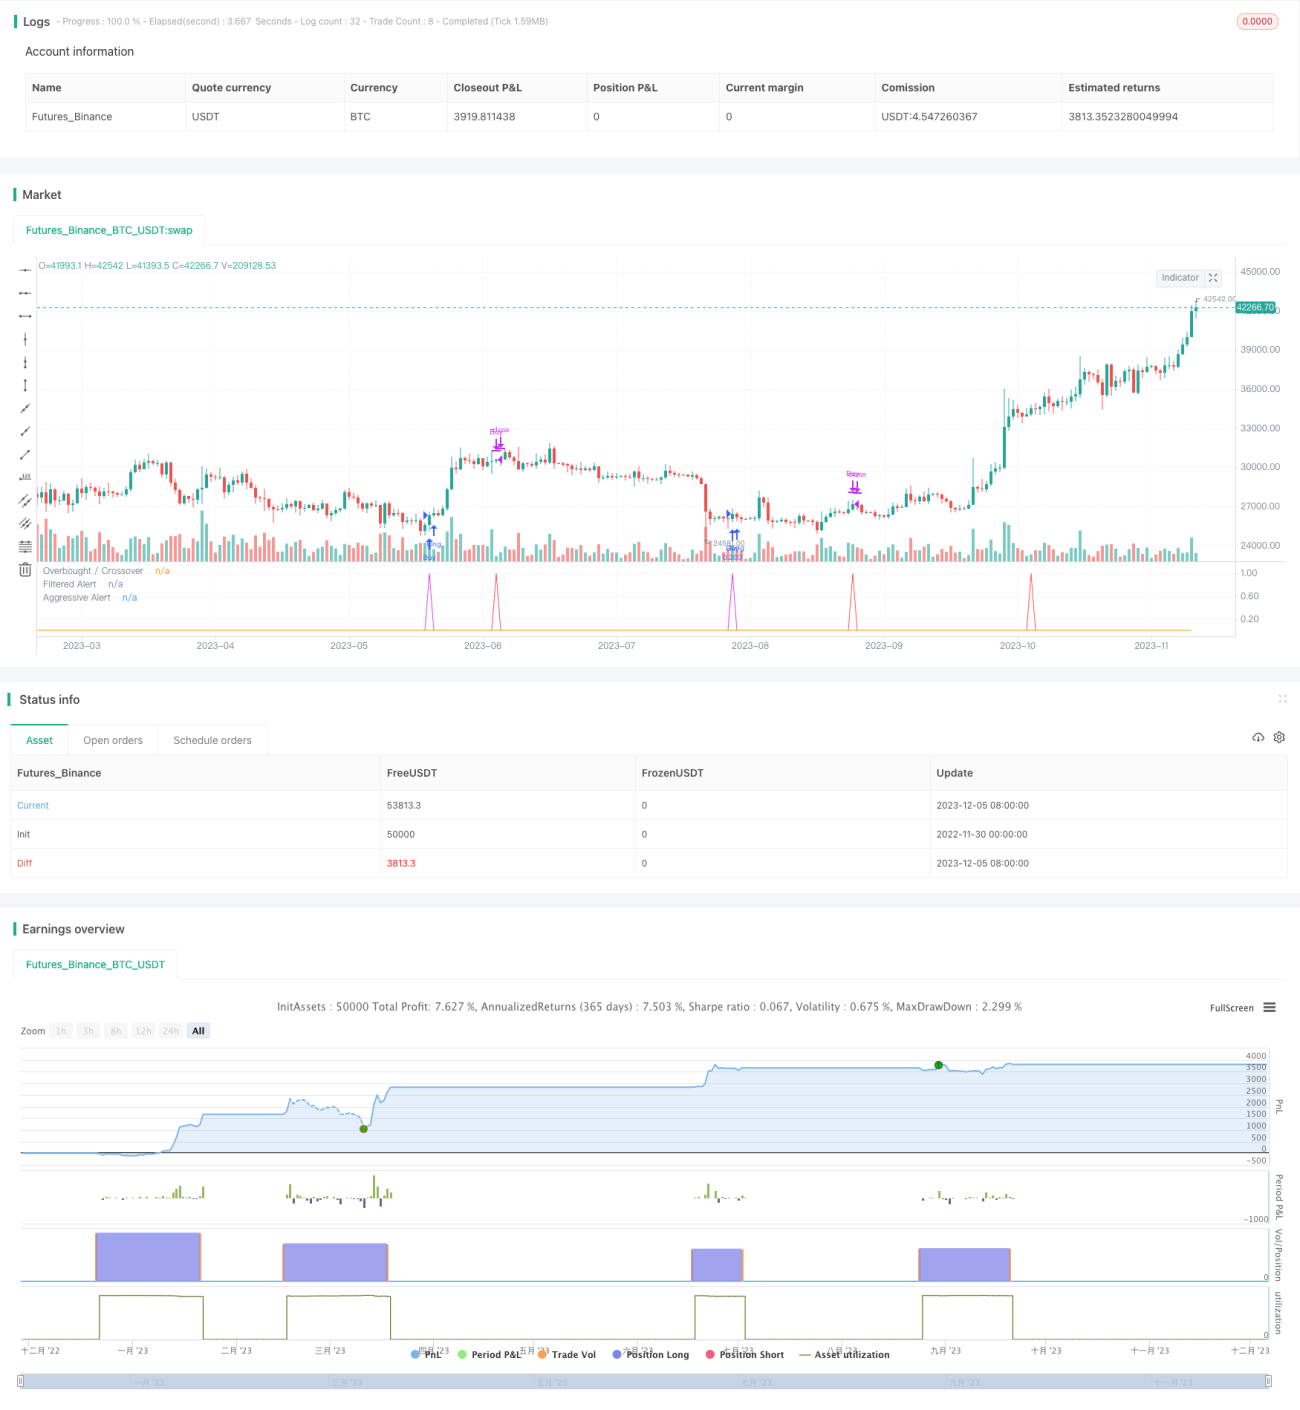

/*backtest
start: 2022-11-30 00:00:00
end: 2023-12-06 00:00:00
period: 1d
basePeriod: 1h
exchanges: [{"eid":"Futures_Binance","currency":"BTC_USDT"}]
*/

//@version=4
strategy("SORAN Buy and Close Buy", pyramiding=1, initial_capital=10000, default_qty_type=strategy.percent_of_equity, default_qty_value=10, overlay=false)

////Buy and Close-Buy messages
Long_message = input("")
Close_message = input("")

///////////// Stochastic Slow
Stochlength = input(14, minval=1, title="lookback length of Stochastic")
StochOverBought = input(80, title="Stochastic overbought condition")
StochOverSold = input(20, title="Stochastic oversold condition")
smoothK = input(3, title="smoothing of Stochastic %K ")
smoothD = input(3, title="moving average of Stochastic %K")
k = sma(stoch(close, high, low, Stochlength), smoothK)
d = sma(k, smoothD)

 
///////////// RSI 
RSIlength = input( 14, minval=1 , title="lookback length of RSI")
RSIOverBought = input( 70  , title="RSI overbought condition")
RSIOverSold = input( 30  , title="RSI oversold condition")
RSIprice = close
vrsi = rsi(RSIprice, RSIlength)

///////////// Double strategy: RSI strategy + Stochastic strategy

pd = input(22, title="LookBack Period Standard Deviation High")
bbl = input(20, title="Bolinger Band Length")
mult = input(2.0    , minval=1, maxval=5, title="Bollinger Band Standard Devaition Up")
lb = input(50  , title="Look Back Period Percentile High")
ph = input(.85, title="Highest Percentile - 0.90=90%, 0.95=95%, 0.99=99%")
new = input(false, title="-------Text Plots Below Use Original Criteria-------" )
sbc = input(false, title="Show Text Plot if WVF WAS True and IS Now False")
sbcc = input(false, title="Show Text Plot if WVF IS True")
new2 = input(false, title="-------Text Plots Below Use FILTERED Criteria-------" )
sbcFilt = input(true, title="Show Text Plot For Filtered Entry")
sbcAggr = input(true, title="Show Text Plot For AGGRESSIVE Filtered Entry")
ltLB = input(40, minval=20, maxval=99, title="Long-Term Look Back Current Bar Has To Close Below This Value OR Medium Term--Default=40")
mtLB = input(14, minval=1, maxval=40, title="Medium-Term Look Back Current Bar Has To Close Below This Value OR Long Term--Default=14")
str = input(3, minval=1, maxval=9, title="Entry Price Action Strength--Close > X Bars Back---Default=3")
//Alerts Instructions and Options Below...Inputs Tab
new4 = input(false, title="-------------------------Turn On/Off ALERTS Below---------------------" )
new5 = input(false, title="----To Activate Alerts You HAVE To Check The Boxes Below For Any Alert Criteria You Want----")
sa1 = input(false, title="Show Alert WVF = True?")
sa2 = input(false, title="Show Alert WVF Was True Now False?")
sa3 = input(false, title="Show Alert WVF Filtered?")
sa4 = input(false, title="Show Alert WVF AGGRESSIVE Filter?")

//Williams Vix Fix Formula
wvf = ((highest(close, pd)-low)/(highest(close, pd)))*100
sDev = mult * stdev(wvf, bbl)
midLine = sma(wvf, bbl)
lowerBand = midLine - sDev
upperBand = midLine + sDev
rangeHigh = (highest(wvf, lb)) * ph

//Filtered Bar Criteria
upRange = low > low[1] and close > high[1]
upRange_Aggr = close > close[1] and close > open[1]
//Filtered Criteria
filtered = ((wvf[1] >= upperBand[1] or wvf[1] >= rangeHigh[1]) and (wvf < upperBand and wvf < rangeHigh))
filtered_Aggr = (wvf[1] >= upperBand[1] or wvf[1] >= rangeHigh[1]) and not (wvf < upperBand and wvf < rangeHigh)

//Alerts Criteria
alert1 = wvf >= upperBand or wvf >= rangeHigh ? 1 : 0
alert2 = (wvf[1] >= upperBand[1] or wvf[1] >= rangeHigh[1]) and (wvf < upperBand and wvf < rangeHigh) ? 1 : 0
alert3 = upRange and close > close[str] and (close < close[ltLB] or close < close[mtLB]) and filtered ? 1 : 0
alert4 = upRange_Aggr and close > close[str] and (close < close[ltLB] or close < close[mtLB]) and filtered_Aggr ? 1 : 0

//Coloring Criteria of Williams Vix Fix
col = wvf >= upperBand or wvf >= rangeHigh ? #00E676 : #787B86

isOverBought = (crossover(k,d) and k > StochOverBought) ? 1 : 0
isOverBoughtv2 = k > StochOverBought ? 1 : 0
filteredAlert = alert3 ? 1 : 0
aggressiveAlert = alert4 ? 1 : 0

plot(isOverBought, "Overbought / Crossover", style=plot.style_line, color=#FF5252) 
plot(filteredAlert, "Filtered Alert", style=plot.style_line, color=#E040FB) 
plot(aggressiveAlert, "Aggressive Alert", style=plot.style_line, color=#FF9800)

if (filteredAlert or aggressiveAlert)
    strategy.entry("Buy", strategy.long, alert_message = Long_message)

if (filteredAlert or aggressiveAlert)
    alert("Buy Signal", alert.freq_once_per_bar)


if (isOverBought)
    strategy.close("Buy", alert_message = Close_message)


More