Trend Trading Strategy Based on Multiple Moving Averages

Overview
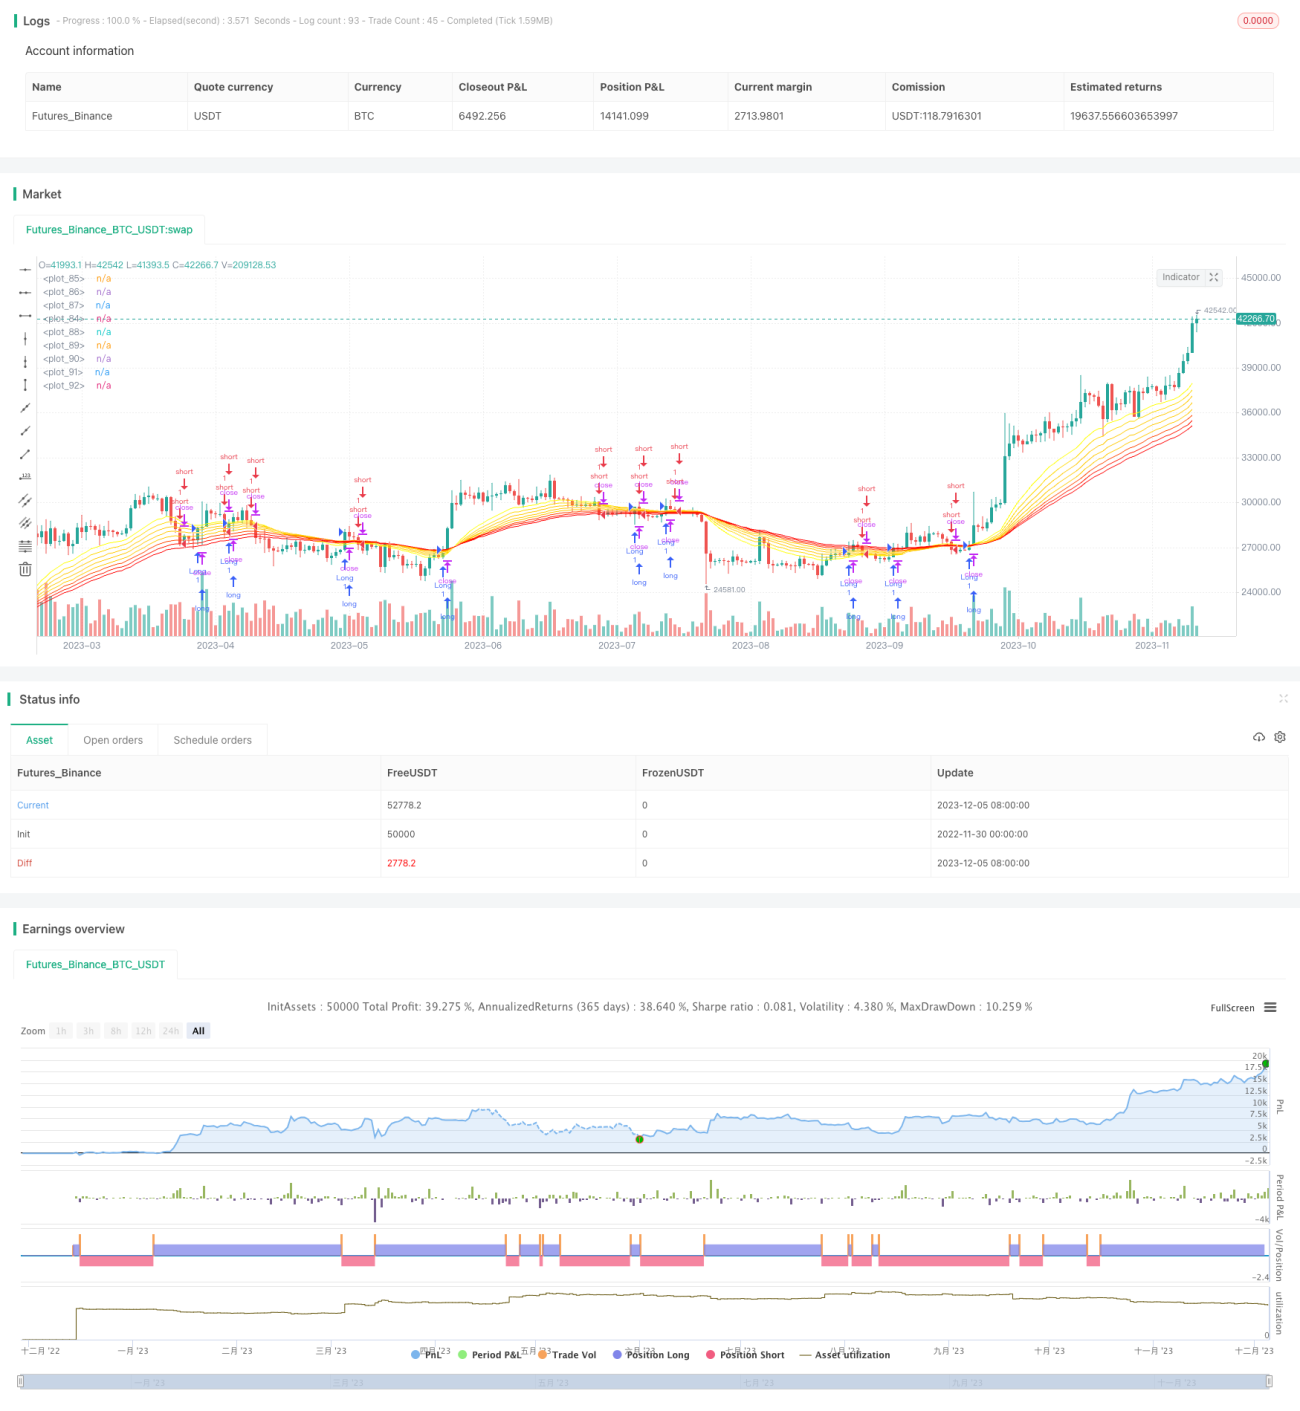
This strategy calculates multiple moving averages of different periods and combines golden cross patterns to determine trend direction for trend following trading. The main functionality is to identify price trend reversal points and generate buy and sell signals.
Strategy Principle
The core of this strategy is the 35-period EMA which serves as the primary indicator for buy and sell signals. When price crosses above the 35EMA, a buy signal is generated. When price crosses below the 35EMA, a sell signal is generated. In addition, the strategy plots an EMA ribbon consisting of 8 EMAs of different periods to aid in determining trend direction. Shorter period EMAs stay closer to price for detecting changes more rapidly, while longer period EMAs lag price changes more slowly to filter some noise. The EMA ribbon clearly depicts the major trend direction of price.
This strategy mainly relies on the 35EMA to determine the major trend. Trading signals are generated when price crosses above or below the 35EMA. The EMA ribbon plays an auxiliary role in confirming the trend and optimizing entry timing.
Advantage Analysis
This strategy strikes a balance between trend following and frequent trading. The 35EMA can basically judge changes in the major trend direction without too much lag, and generates trading signals around significant turning points. The EMA ribbon forms a trend channel for confirming opportunities to enter long or short positions with better timing.
Compared to using a single EMA indicator, this multi-EMA approach provides more comprehensive and clearer trend determination. The combination of different period EMAs ensures judging the longer-term trend direction while smoothing some short-term market noise through integrating high and low frequency EMAs.
Users can tweak parameters on their own to change the main 35EMA period or the EMAs in the ribbon to optimize for their own trading style. Overall, this strategy offers a relatively accurate and versatile solution for trend trading.
Risk Analysis
The main risk lies in the user's choice of parameters. Using EMA periods that are too short increases trade frequency and risk. Periods that are too long may cause missing major turning points and lag entries.
Another key risk is during range-bound markets, the EMA indicator can generate multiple false signals. Users need to apply additional trend analysis to avoid blind entries.
Finally, during strong trending markets, indicator lag may delay buy and sell signals. Users should anticipate turning points instead of purely relying on signals.
Optimization Directions
The main ways to optimize this strategy focus on adjusting EMA parameters to suit different markets and trading styles:
- Fine tune the 35EMA period for better timing of trade signals
- Adjust EMA ribbon periods for better trend judgment
- Incorporate other supporting indicators like BOLL bands and KDJ for confirmation
- Add volume measures to avoid acting in volatile markets with no volume increase
Through parameter tuning and combining signals from multiple indicators, further improvements in stability and signal accuracy can be achieved. This reduces trading risks and achieves better returns.
Conclusion
This strategy provides a relatively accurate and versatile trend following solution through calculating multiple EMAs and using the EMA ribbon. It balances capturing turning points promptly and judging multi-timeframe trends holistically for a good mix of trade frequency and system stability. Through optimization it adapts across market environments, asset types and trading styles. It offers users a sophisticated and robust foundation for quantitative trading.
- 1