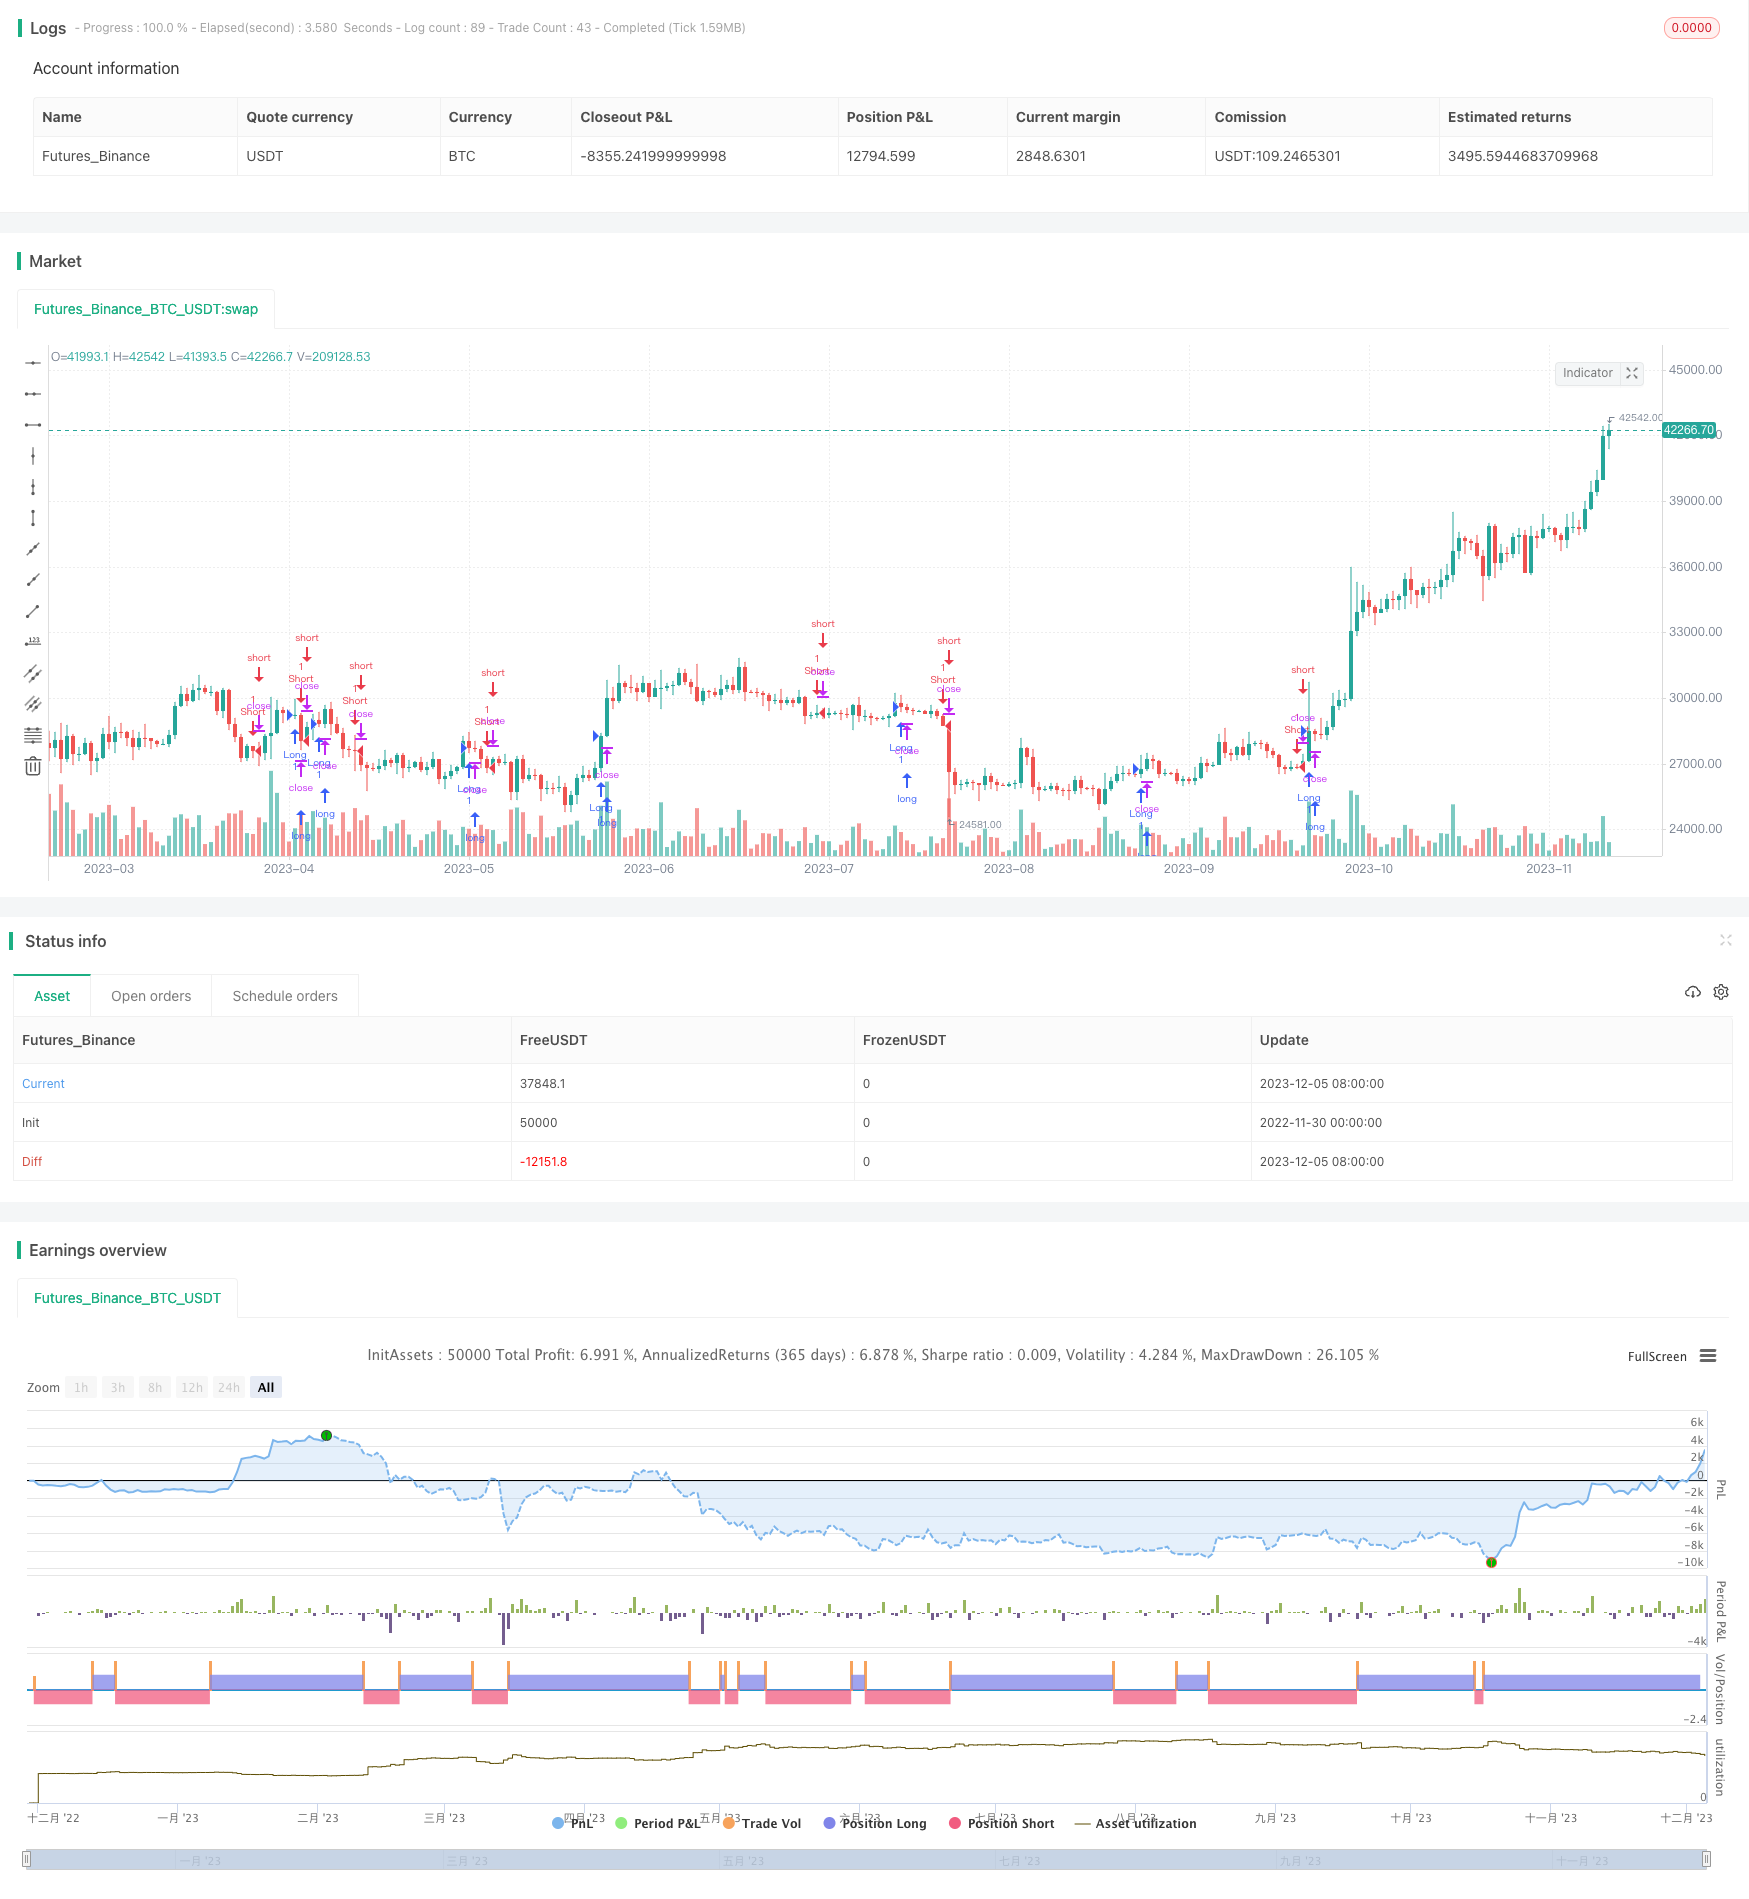
概述
自适应移动平均线策略(Mala Adaptive Moving Average Strategy)是一个基于John Ehlers的MESA自适应移动平均线指标的量化交易策略。该策略运用正弦波进行交易决策,在低点买入,高点卖出,通过滑动调节参数使正弦波能够自适应不同品种和市场环境。
策略原理
自适应移动平均线策略使用正弦波生成器来产生交易信号。正弦波由一个转动的矢量(这称为相量)在竖直轴上投下的阴影确定。矢量转过360度时,完成一个周期。当矢量通过某个角度时就产生买入信号,通过另一个角度时产生卖出信号。这样,交易决策就是由频域中的角度定义的,而不是时域中的波形特征,可以使策略更加鲁棒,适应不同品种和市场环境。
具体来说,该策略首先对价格进行平滑和去趋势化处理,然后计算正弦波的两个分量:同相分量I和正交分量Q。这两个分量通过相位平移进行叠加和滤波,得到最终的Re和Im。Re和Im反映正弦波的频率信息,通过atan(Im/Re)可以推导出周期period。根据期望的周期范围确定一个平滑的周期smoothperiod。周期和相位信息确定MAMA和FAMA曲线,其交叉产生交易信号。参数alpha通过周期和相位变化率deltaphase动态调节,在一定范围内上下波动,使指标能够自适应市场环境的变化。
优势分析
自适应移动平均线策略具有以下优势:
使用正弦波和相位作为交易信号,使策略更加鲁棒,不受时域波形的影响。
周期和参数可以动态调整适应市场变化,具有很强的自适应能力。
MAMA和FAMA曲线只依赖价格本身的特征,没有滞后,可以及时捕捉趋势转换。
通过参数設定可以调整策略的灵敏度,适合不同风格的交易者。
策略逻辑清晰简单,容易理解和修改,适合用于研究和教学。
风险分析
自适应移动平均线策略也存在以下风险:
由于依赖正弦曲线周期和相位,当价格出现异常扭曲时会产生错误信号。
在周期判断时设置了硬性边界,这会使周期变化不够平滑。
相位和周期的蜂窝效应会使曲线在关键点附近震荡,可能错过最佳 Entries 和 Exits。
当市场波动加剧时,参数和曲线的自适应能力会下降。
作为技术指标,策略容易在重要技术位置出现假突破和错误信号。
这些风险可以通过设置更平滑的参数,结合其他指标进行过滤,调整持仓规模等方法加以缓解。
优化方向
自适应移动平均线策略可以从以下几个方面进行优化:
改进周期和参数的计算方法,使其变化更加平滑自然。例如可以引入统计方法对价格进行更好的建模。
结合波动率、成交量等指标对信号进行过滤,提高准确率。也可以结合基本面理解信号的可靠性。
优化参数设置和滑点控制,降低交易成本,提高系统的稳健性。
引入机器学习和遗传算法等方法动态优化参数,使系统参数不断演化和更新。
设定不同的 Entries 和 Exits,结合趋势和反转系统,建立组合,提高持续盈利能力。
总结
自适应移动平均线策略运用正弦波分析产生交易信号,通过动态调节参数使得系统能够自主适应市场环境的变化,具有较强的鲁棒性和广泛的适用性。相比其他自适应移动平均线策略,它有更高的实战性和稳定性。但该策略作为一个技术策略,在关键技术位也会出现错误信号,这需要引入其他辅助工具进行过滤优化。通过不断完善,该策略有望成为一个值得推荐的自适应交易系统。
/*backtest
start: 2022-11-30 00:00:00
end: 2023-12-06 00:00:00
period: 1d
basePeriod: 1h
exchanges: [{"eid":"Futures_Binance","currency":"BTC_USDT"}]
*/

// This source code is subject to the terms of the Mozilla Public License 2.0 at https://mozilla.org/MPL/2.0/
// © dongyun

//@version=4
strategy("自适应移动平均的MESA系统", overlay=true)

fastlimit = input(0.5,'')
slowlimit = input(0.05,'')

smooth = 0.0
detrender = 0.0
I1 = 0.0
Q1 = 0.0
JI = 0.0
JQ = 0.0
I2 = 0.0
Q2 = 0.0
Re = 0.0
Im = 0.0
period = 0.0
smoothperiod = 0.0
phase = 0.0
deltaphase = 0.0
alpha = 0.0
MAMA = 0.0
FAMA = 0.0
price = 0.0

price := (high + low)/2
PI = 2 * asin(1)

if (bar_index > 5)
	smooth := (4*price + 3*price[1] + 2*price[2] + price[3])/10
	detrender := (.0962*smooth + .5769*nz(smooth[2]) - .5769*nz(smooth[4]) - .0962*nz(smooth[6]))*(.075*nz(period[1]) + .54)

	// compute InPhase and Quadrature components
	Q1 := (.0962*detrender + .5769*nz(detrender[2]) - .5769*nz(detrender[4]) - .0962*nz(detrender[6]))*(.075*nz(period[1]) + .54)

	I1 := nz(detrender[3])

	// advance the pulse of i1 and q1 by 90 degrees
	JI := (.0962*I1 + .5769*nz(I1[2]) - .5769*nz(I1[4]) - .0962*nz(I1[6]))*(.075*nz(period[1]) + .54)
	JQ := (.0962*Q1 + .5769*nz(Q1[2]) - .5769*nz(Q1[4]) - .0962*nz(Q1[6]))*(.075*nz(period[1]) + .54)

	//phase addition for 3-bar averaging
	I2 := I1 - JQ
	Q2 := Q1 + JI

	//smooth the i and q components before applying
	I2 := .2*I2 + .8*nz(I2[1])
	Q2 := .2*Q2 + .8*nz(Q2[1])

	// hymodyne discriminator
	Re := I2*I2[1] + Q2*nz(Q2[1])
	Im := I2*Q2[1] + Q2*nz(I2[1])
	Re := .2*Re + .8*nz(Re[1])
	Im := .2*Im + .8*nz(Im[1])

	if (Im != 0 and Re != 0)
		period := 2 * PI/atan(Im/Re)

	if (period > 1.5 * nz(period[1]))
		period := 1.5*nz(period[1])

	if (period < .67*nz(period[1]))
		period := .67*nz(period[1])

	if (period < 6)
		period := 6

	if (period > 50)
		period := 50

	period := .2*period + .8*nz(period[1])
	smoothperiod := .33*period + .67*nz(smoothperiod[1])

	if (I1 != 0)
		phase := (180/PI) * atan(Q1/I1)

	deltaphase := nz(phase[1]) - phase

	if (deltaphase < 1)
		deltaphase := 1

	alpha := fastlimit/deltaphase
	if(alpha < slowlimit)
		alpha := slowlimit

	MAMA := alpha*price + (1 - alpha)*nz(MAMA[1])
	FAMA := .5*alpha*MAMA + (1 - .5*alpha)*nz(FAMA[1])

	if (FAMA < MAMA)
		strategy.entry("Long", strategy.long)
	else
		if (FAMA > MAMA)
			strategy.entry("Short", strategy.short)