BTC Trading Strategy Based on Moving Average Crossover

Overview
This strategy is based on the golden cross and death cross signals of the 50-day moving average and the 200-day moving average of BTC, combined with additional technical indicators to generate buy and sell signals. This strategy is mainly suitable for currency pairs with obvious trend characteristics like BTC/USDT.
Strategy Principle
When the 50-day moving average crosses above the 200-day moving average to form a "golden cross", it indicates that BTC has entered a bull market and generates a buy signal. While when the 50-day moving average crosses below the 200-day moving average to form a "death cross", it indicates that BTC has entered a bear market and generates a sell signal.
In addition to the basic moving average "golden cross" and "death cross" signal judgment, this strategy also incorporates some additional technical indicators to assist in judgment, including:
-
EMA indicator: Calculate an EMA indicator with length+offset, when it goes up indicates the current market is bullish, we can buy.
-
Compare the value relationship between moving average and EMA: If EMA value is higher than 50-day moving average, a buy signal is generated.
-
Check if the price has fallen more than 1% compared to the low of the previous K-line, if so generate a sell signal.
By combining the use of several indicators above, some wrong signals can be filtered out and the trading decisions of the strategy can be more reliable.
Advantage Analysis
This strategy has the following advantages:
-
Using moving averages as the main trading signal can filter market noise and identify trend direction.
-
Combining with multiple auxiliary technical indicators can enhance signal reliability and filter out false signals.
-
Adopting appropriate stop-loss strategies can effectively control single loss.
-
The relatively simple trading logic is easy to understand and implement, suitable for beginners of quantitative trading.
-
There are many configurable parameters that can be adjusted according to your own preferences.
Risk Analysis
This strategy also has some risks to note:
-
The moving average itself has a strong lagging attribute, possibly missing opportunities for rapid price reversal.
-
Adding assistant indicators increases the number of rules and also increases the probability of generating wrong signals.
-
Improper stop-loss settings may lead to enlarged losses.
-
Inappropriate parameter settings (such as moving average length, etc.) will also affect strategy results.
The corresponding solutions:
-
Appropriately shorten the moving average cycle and increase the parameter optimization range.
-
Increase backtest data quantity to check signal quality.
-
Properly relax the stop loss range while setting take profit stops.
-
Increase parameter optimization to find the best parameter combinations.
Optimization Directions
This strategy can also be optimized in the following directions:
-
Increase machine learning algorithms to achieve automatic parameter optimization.
-
Add more auxiliary indicators to build multiple sub-strategies and make decisions through a voting mechanism.
-
Try breakout strategies to identify price breakthroughs.
-
Use deep learning to predict price trends.
-
Optimize stop-loss mechanisms to achieve dynamic tracking stop-loss.
The above optimizations can improve decision accuracy and enhance the profitability and stability of the strategy.
Summary
This strategy mainly makes trading decisions based on the moving average crossover of BTC, assisted by technical indicators such as EMA to filter signals. The strategy has strong trend-following capability and high configurability, making it suitable as a beginner's quantitative trading strategy. But there are also certain lagging risks that need to be guarded against. The next optimization directions can be from multiple dimensions such as machine learning, portfolio strategies, stop-loss strategies, etc.
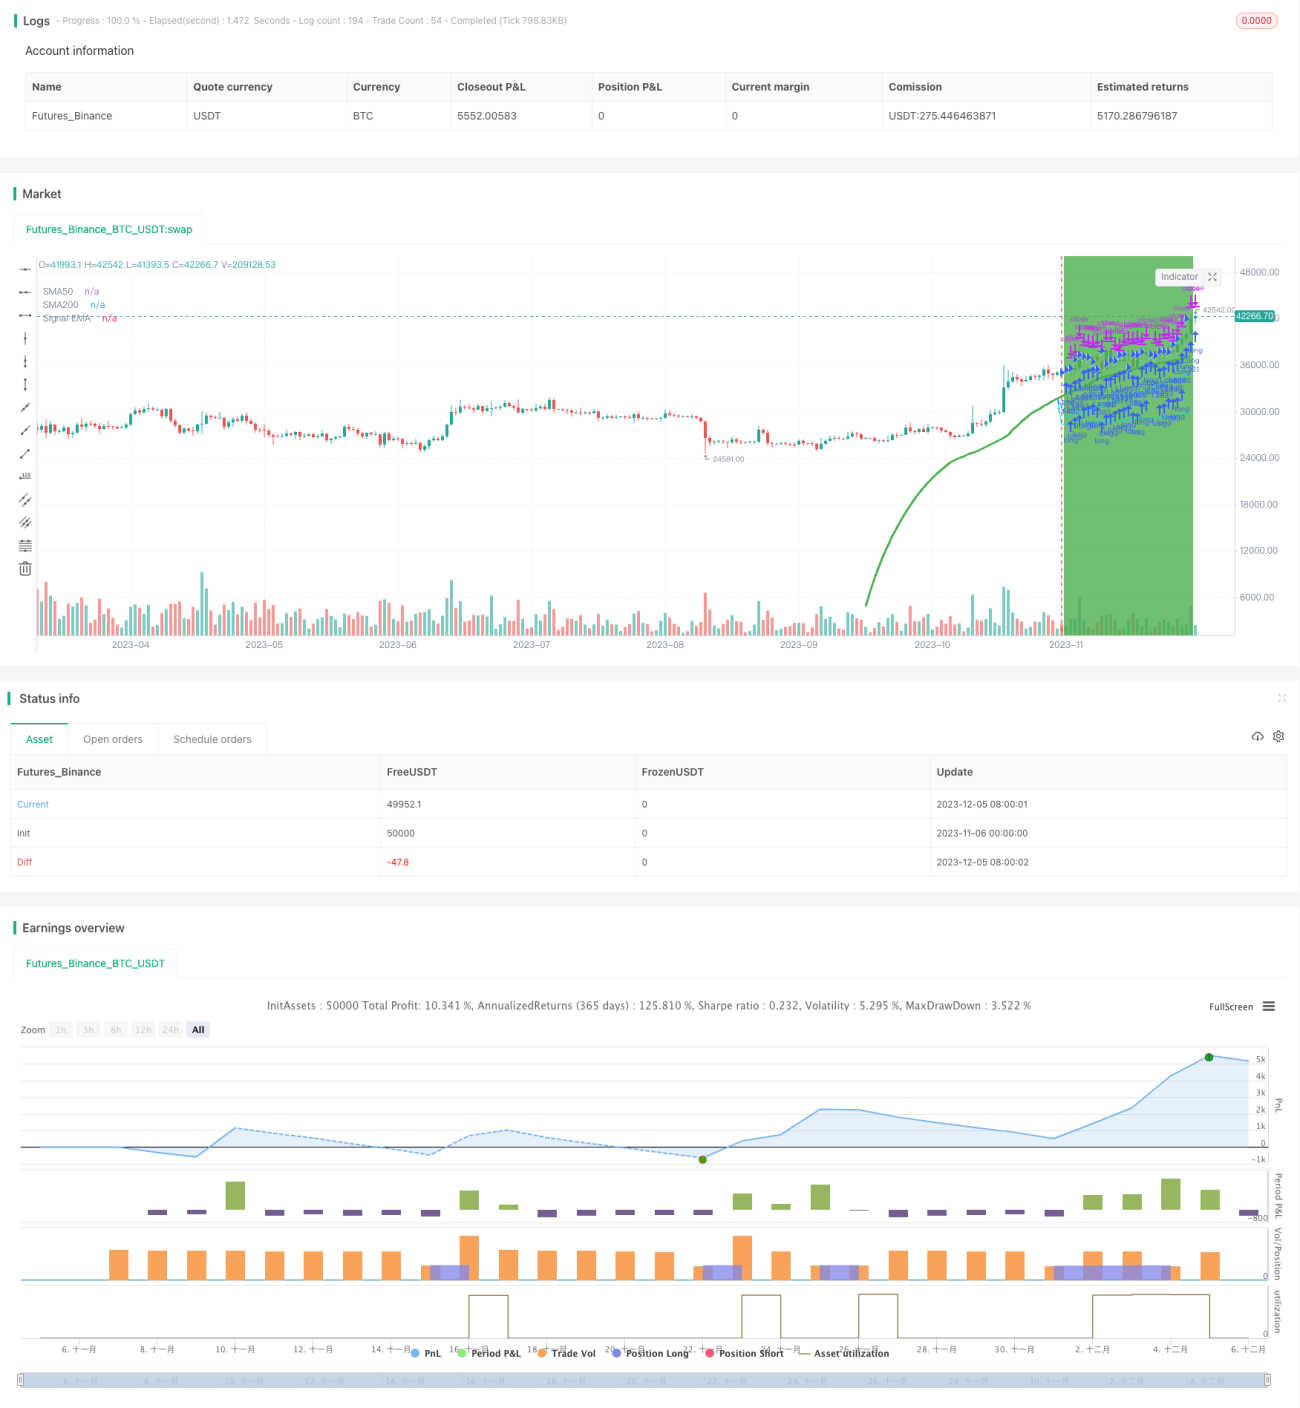
/*backtest
start: 2023-11-06 00:00:00
end: 2023-12-06 00:00:00
period: 1d
basePeriod: 1h
exchanges: [{"eid":"Futures_Binance","currency":"BTC_USDT"}]
*/

//@version=5
strategy('JayJay BTC Signal', overlay=true, initial_capital=100, currency='USD', default_qty_value=100, default_qty_type=strategy.percent_of_equity, commission_value=0, calc_on_every_tick=true)

securityNoRepaint(sym, tf, src) => request.security(sym, tf, src[barstate.isrealtime ? 1 : 0])[barstate.isrealtime ? 0 : 1]- 1