Z-Score Price Breakout Strategy

Overview
The Z-Score price breakout strategy uses the z-score indicator of price to determine whether the current price is in an abnormal state, so as to generate trading signals. When the z-score of price is higher or lower than a threshold, it means the price has entered an abnormal state, at which point long or short positions can be taken.
Strategy Principle
The core indicator of this strategy is the z-score of price, calculated as follows:
mylang
Z_score = (C - SMA(n)) / StdDev(C,n)
Where C is the closing price, SMA(n) is the simple moving average of n periods, and StdDev(C,n) is the standard deviation of closing price for n periods.
The z-score reflects the degree of deviation of the current price from the average price. When the price z-score is greater than a certain positive threshold (e.g. +2), it means the current price is above the average price by 2 standard deviations, which is a relatively high level. When it is less than a certain negative threshold (e.g. -2), it means the current price is below the average price by 2 standard deviations, which is a relatively low level.
This strategy first calculates the z-score of price, then sets a positive and negative threshold (e.g. 0 and 0). When the z-score is higher than the positive threshold, it generates a buy signal. When lower than the negative threshold, it generates a sell signal.
Advantage Analysis
- Using price z-score to judge price anomalies is a common and effective quantitative method
- Easily achieve both long and short trading
- Flexible parameter settings, adjustable cycle, threshold, etc.
- Can be combined with other indicators to form a trading system
Risk Analysis
- The z-score strategy is crude and prone to false signals
- Need to set appropriate parameters like cycle and threshold
- Need to consider stop loss strategies to control risk
Optimization Directions
- Optimize cycle parameters to find the best cycle
- Optimize positive and negative thresholds to reduce false signals
- Add filter conditions, combine with other indicators
- Add stop loss strategies
Summary
The z-score price breakout strategy judges whether the current price is in an abnormal state, and trades according to the positive and negative of the price z-score. This strategy is simple and easy to implement, allows two-way trading, but also has some risks. By optimizing parameters, adding stop loss and combining with other indicators, this strategy can be enhanced to form a complete quantitative trading system.
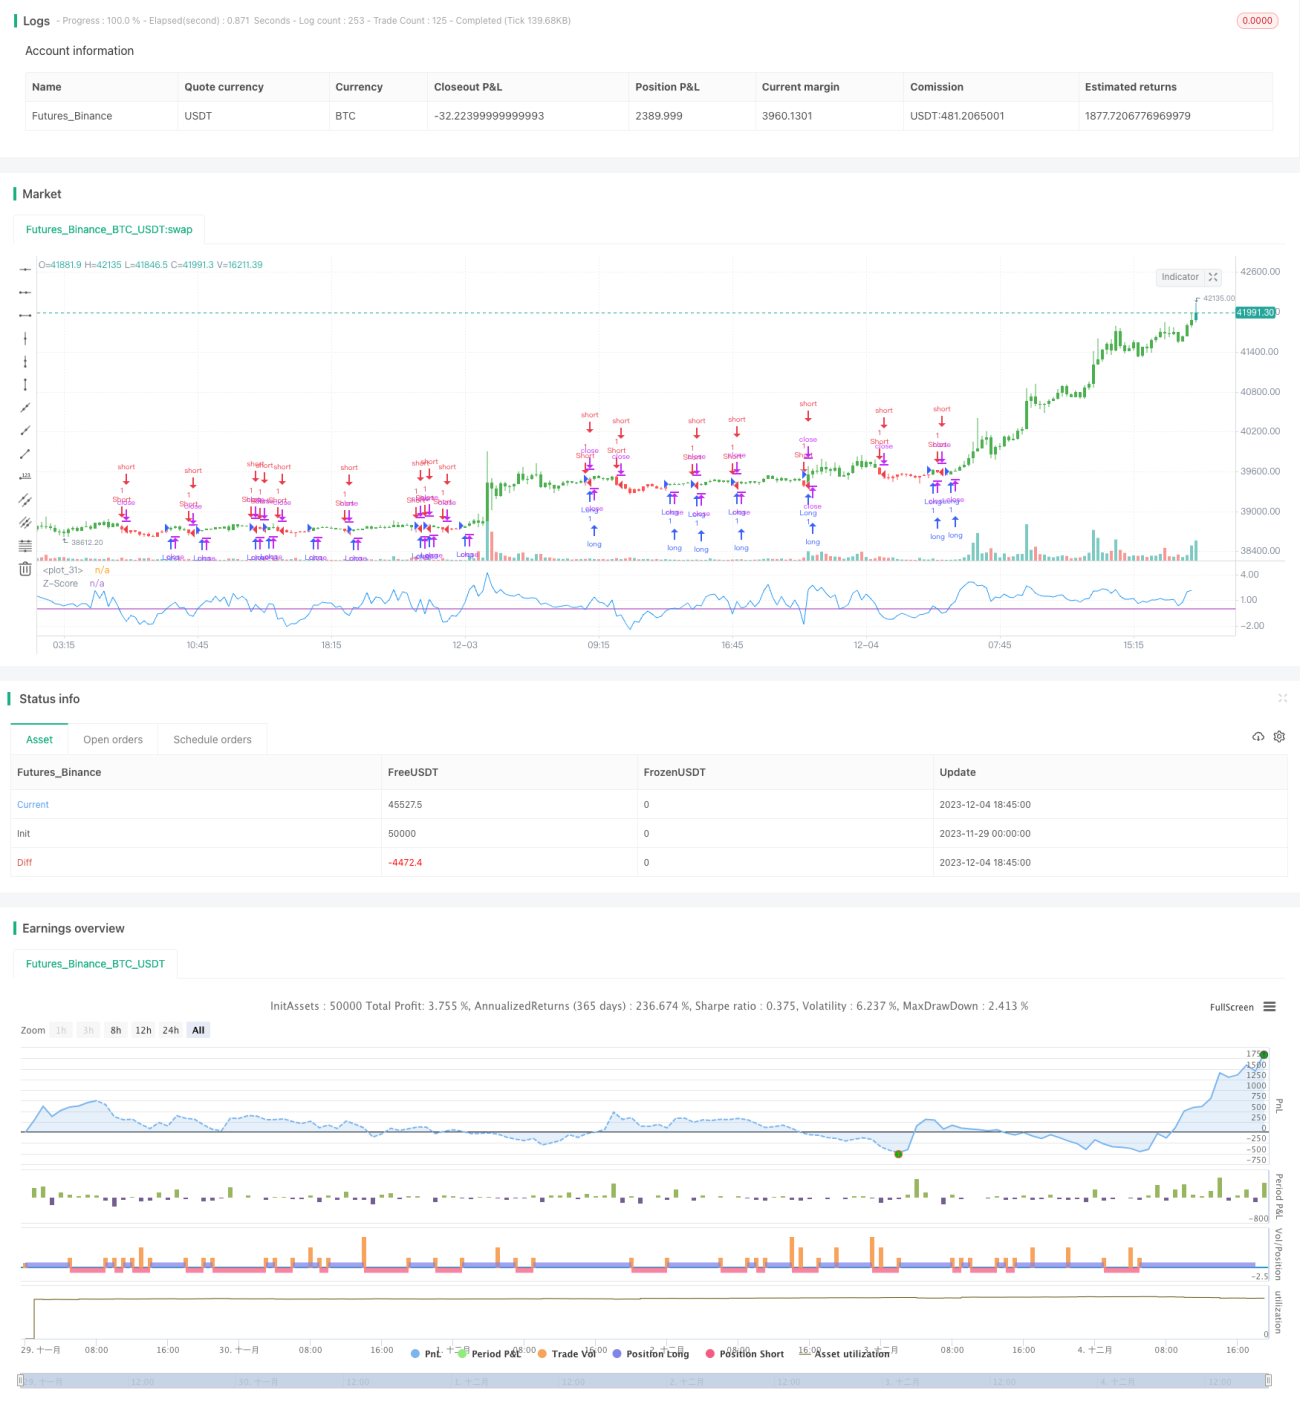
/*backtest
start: 2023-11-29 00:00:00
end: 2023-12-04 19:00:00
period: 15m
basePeriod: 5m
exchanges: [{"eid":"Futures_Binance","currency":"BTC_USDT"}]
*/

//@version=2
////////////////////////////////////////////////////////////
//  Copyright by HPotter v1.0 18/01/2017
// The author of this indicator is Veronique Valcu. The z-score (z) for a data - 1