Slow Moving Average Strategy

Author: ChaoZhang, Date: 2023-12-07 15:21:45
Tags:

img

Overview

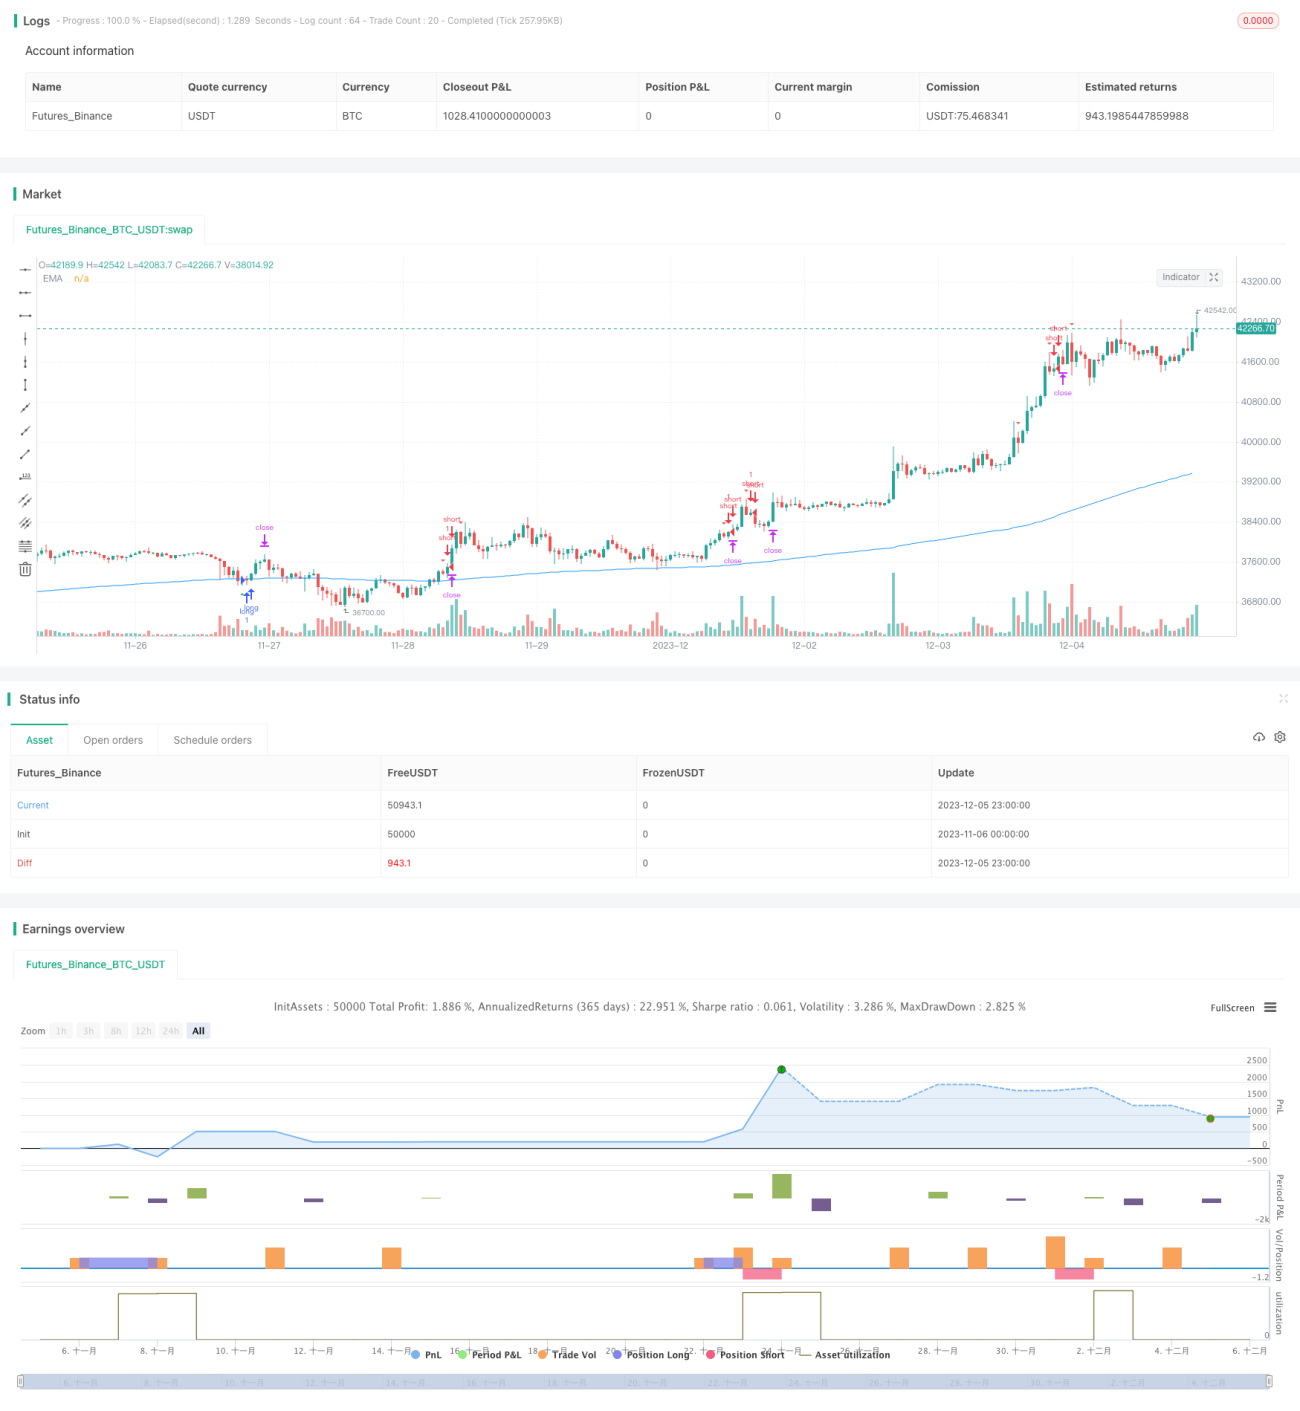
This strategy uses a 24-period Donchian Channel combined with a 200-period moving average as the main trading signals. Short positions are opened when price fluctuates downward and long positions when it fluctuates upward.

Strategy Logic

The strategy logic is mainly based on the following points:

  1. A Donchian Channel is constructed using the highest high and lowest low over the past 24 periods. When price breaks out of this channel, it indicates a potential for larger moves up or down.

  2. The 200-period moving average acts as a filter for long/short bias. If price breaks the Donchian Channel and is on the other side of the moving average, a reversal may be likely.

  3. Entry signals are:

  • Short: The close of the previous bar is above the upper band of the Donchian Channel and below the 200-period MA. The open of the current bar is below the previous close and the low is below the 200-MA.
  • Long: The close of the previous bar is below the lower band of the Donchian Channel and above the 200-period MA. The open of the current bar is above the previous close and the high is above the 200-MA.
  1. The stop loss for short positions is set to the highest high over the past 3 bars. Take profit is set to the entry price minus 3 times the difference between the stop loss and entry price. The long position stop loss and take profit logic is the opposite.

  2. The advantage of this strategy is that by combining the Donchian Channel and moving average filter, it avoids false signals from relying on a single indicator, significantly improving win rate.

Advantage Analysis

The strategy has the following advantages:

  1. High win rate: By combining the Donchian Channel and moving average filter, unnecessary losses due to false signals from a single indicator are avoided.

  2. Controllable risk: Using the recent highest high/lowest low as stop loss levels effectively manages downside on losing trades. The 3:1 profit to loss ratio is attractive.

  3. Simple and easy to implement: The logic uses simple, intuitive indicators that are easy to understand and execute.

  4. Robustness across markets and timeframes: With relatively few parameters, the strategy is stable across different products and timeframes.

Risk Analysis

The main risks faced by this strategy are:

  1. Extreme market moves: Very strong one-way trends can trigger stop losses causing amplified losses. This can be mitigated by widening stops or reducing position size.

  2. Premature exit signal risk: Exiting on new opposite signals can cause over-trading in choppy markets due to repeated entry and exit. Optimizing exit logic can help address this.

  3. Parameter optimization risk: Poor parameter tuning of the Donchian Channel lookback period or moving average can lead to delayed or frequent signals. This can be minimized through rigorous optimization and combinatorial testing.

Enhancement Opportunities

The strategy can be enhanced in the following ways:

  1. Optimize Donchian Channel and moving average lookback periods to find best combination of parameters.

  2. Test different stop loss to take profit ratios to balance win rate versus reward/risk.

  3. Incorporate additional filters on entry signals using indicators like MACD, RSI etc. to improve robustness.

  4. Optimize exit logic to avoid unnecessary exits in choppy markets. Trend metrics can also be considered for exits.

  5. Develop new combinations using this strategy framework, for e.g. with other channels, band indicators etc.

Conclusion

The Slow Moving Average strategy has clear, easy to understand logic using a combination of Donchian Channel and moving average for signal generation. This hybrid approach significantly improves stability and win rate. The 3:1 profit to loss ratio also provides good reward potential. While risks exist in terms of extreme moves and signal errors, numerous optimization opportunities can improve performance and expand on the core strategy.


/*backtest
start: 2023-11-06 00:00:00
end: 2023-12-06 00:00:00
period: 1h
basePeriod: 15m
exchanges: [{"eid":"Futures_Binance","currency":"BTC_USDT"}]
*/

// This source code is subject to the terms of the Mozilla Public License 2.0 at https://mozilla.org/MPL/2.0/
// © Mysteriown

//@version=4

strategy("Lagged Donchian Channel + EMA", overlay = true)

//tradePeriod = time(timeframe.period,"0000-0000:1234567")?true:false


// ------------------------------------------ //
// ----------------- Inputs ----------------- //
// ------------------------------------------ //

period = input(24, title="Channel's periods")
Pema = input(200, title="EMA's periods ?")
ratio = input(3, title="Ratio TP", type=input.float)
loss = input(20, title="Risk Loss ($)")
lev = input(5, title="Leverage *...")
chan = input(title="Plot channel ?", type=input.bool, defval=false)
Bpos = input(title="Plot Bull positions ?", type=input.bool, defval=false)
bpos = input(title="Plot Bear positions ?", type=input.bool, defval=false)
labels = input(title="Plot labels of bets ?", type=input.bool, defval=true)
supp = input(title="Delete last labels ?", type=input.bool, defval=true)


// ------------------------------------------ //
// ---------- Canal, EMA and arrow ---------- //
// ------------------------------------------ //

pema = ema(close,Pema)
plot(pema, title="EMA", color=color.blue)

canalhaut = highest(period)[1]
canalbas = lowest(period)[1]

bear = close[1] > canalhaut[1] and close < open and high > pema
bull = close[1] < canalbas[1] and open < close and low < pema

canalhautplot = plot(chan? canalhaut:na, color=color.yellow)
canalbasplot = plot(chan? canalbas:na, color=color.yellow)

plotshape(bear, title='Bear', style=shape.triangledown, location=location.abovebar, color=color.red, offset=0)
plotshape(bull, title='Bull', style=shape.triangleup, location=location.belowbar, color=color.green, offset=0)


// ------------------------------------------ //
// ------------- Position Short ------------- //
// ------------------------------------------ //

SlShort = highest(3)
BidShort = close[1]

TpShort = BidShort-((SlShort-BidShort)*ratio)
deltaShort = (SlShort-BidShort)/BidShort
betShort = round(loss/(lev*deltaShort)*100)/100
cryptShort = round(betShort*lev/BidShort*1000)/1000

// if bear[1] and labels //and low < low[1]
//     Lbear = label.new(bar_index, na, text="SHORT\n\nSL: " + tostring(SlShort) + "\n\nBid: " + tostring(BidShort) + "\n\nTP: " + tostring(TpShort) + "\n\nMise: " + tostring(betShort) + "\n\nCryptos: " + tostring(cryptShort), color=color.red, textcolor=color.white, style=label.style_labeldown, yloc=yloc.abovebar)
//     label.delete(supp ? Lbear[1] : na)

var bentry=0.0
var bsl=0.0
var btp=0.0

if bear[1] and low < low[1]
    bentry:=BidShort
    bsl:=SlShort
    btp:=TpShort
    
pbentry = plot(bpos? bentry:na, color=color.orange)
plot(bpos? (bentry+btp)/2:na, color=color.gray)
pbsl = plot(bpos? bsl:na, color=color.red)
pbtp = plot(bpos? btp:na, color=color.green)

fill(pbentry,pbsl, color.red, transp=70)
fill(pbentry,pbtp, color.green, transp=70)


// ------------------------------------------ //
// ------------- Position Long -------------- //
// ------------------------------------------ //

SlLong = lowest(3)
BidLong = close[1]

TpLong = BidLong + ((BidLong - SlLong) * ratio)
deltaBull = (BidLong - SlLong)/BidLong
betLong = round(loss/(lev*deltaBull)*100)/100
cryptLong = round(betLong*lev/BidLong*1000)/1000

// if bull[1] and labels //and high > high[1]
//     Lbull = label.new(bar_index, na, text="LONG\n\nSL: " + tostring(SlLong) + "\n\nBid: " + tostring(BidLong) + "\n\nTP: " + tostring(TpLong) + "\n\nMise: " + tostring(betLong) + "\n\nCryptos: " + tostring(cryptLong), color=color.green, textcolor=color.white, style=label.style_labelup, yloc=yloc.belowbar)
//     label.delete(supp ? Lbull[1] : na)

var Bentry=0.0
var Bsl=0.0
var Btp=0.0

if bull[1] and high > high[1]
    Bentry:=BidLong
    Bsl:=SlLong
    Btp:=TpLong
    
pBentry = plot(Bpos?Bentry:na, color=color.orange)
plot(Bpos?(Bentry+Btp)/2:na, color=color.gray)
pBsl = plot(Bpos?Bsl:na, color=color.red)
pBtp = plot(Bpos?Btp:na, color=color.green)

fill(pBentry,pBsl, color.red, transp=70)
fill(pBentry,pBtp, color.green, transp=70)


// ------------------------------------------ //
// --------------- Strategie ---------------- //
// ------------------------------------------ //

Bear = bear[1] and low < low[1]
Bull = bull[1] and high > high[1]

if (Bear and strategy.opentrades==0)
    strategy.order("short", false, 1, limit=BidShort)
    strategy.exit("exit", "short", limit = TpShort, stop = SlShort)

strategy.cancel("short", when = high > SlShort or low < (BidShort+TpShort)/2)
strategy.close("short", when=bull)

if (Bull and strategy.opentrades==0)
    strategy.order("long", true, 1, limit=BidLong)
    strategy.exit("exit", "long", limit = TpLong, stop = SlLong)
    
strategy.cancel("long", when = low < SlLong or high > (BidLong+TpLong)/2)
strategy.close("long", when=bear)


More