John's Bitcoin Intraday Trading Strategy Based on Multiple Indicators

Overview
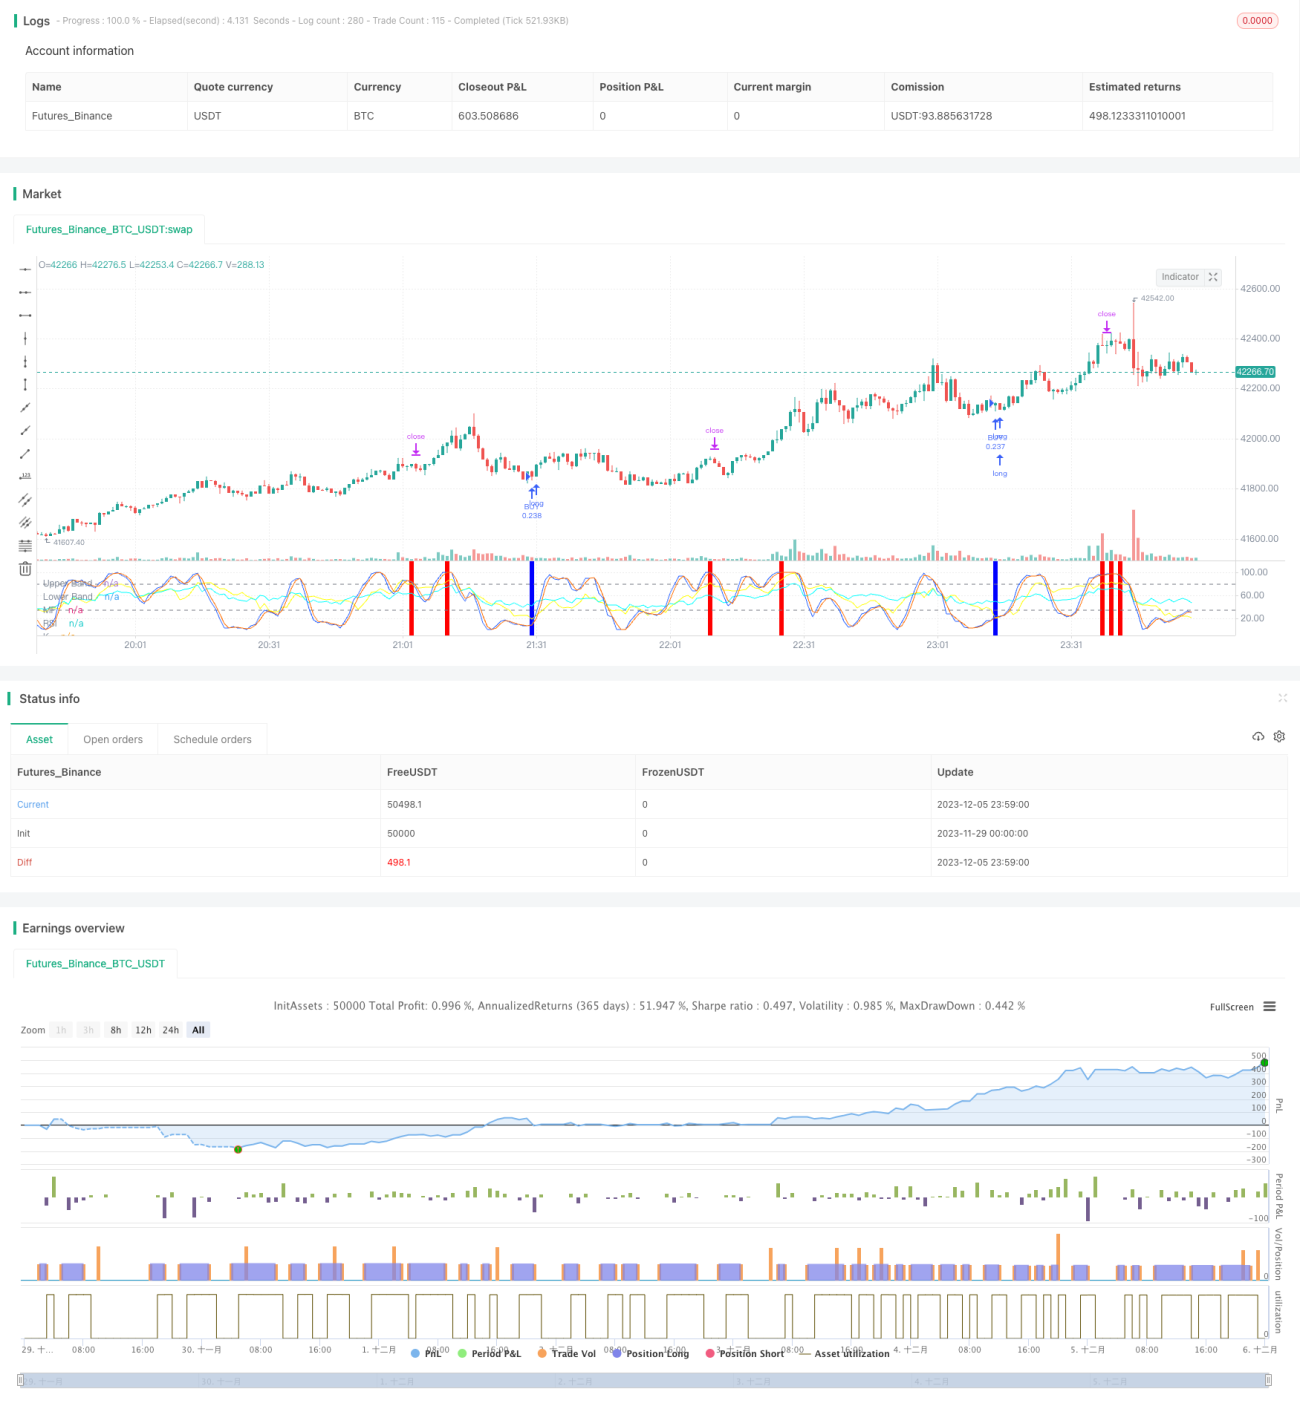
This strategy combines RSI, MFI, Stoch RSI and MACD four indicators to implement bitcoin intraday trading. Orders will only be placed when multiple indicators give buy or sell signals simultaneously to control risks.
Strategy Logic
-
The RSI indicator is used to determine whether the market is overbought or oversold. It generates a buy signal when RSI is below 40 and a sell signal when RSI is above 70.
-
The MFI indicator judges the capital flow in the market. It generates a buy signal when MFI is below 23 and a sell signal when MFI is above 80.
-
The Stoch RSI indicator determines whether the market is overbought or oversold. It generates a buy signal when the K line is below 34 and a sell signal when above 80.
-
The MACD indicator judges the market trend and momentum. It generates a buy signal when the fast line is below the slow line and the histogram is negative, and a sell signal for the opposite scenario.
Advantage Analysis
-
Combining four major indicators improves signal accuracy and avoids losses caused by the failure of a single indicator.
-
Orders are placed only when multiple indicators give signals simultaneously, which greatly reduces the probability of false signals.
-
Adopting intraday trading strategies avoids overnight risks and reduces capital costs.
Risks and Solutions
-
The strategy's trading frequency may be relatively low, with certain time risks. Indicator parameters can be appropriately relaxed to increase the number of trades.
-
There is still a probability that indicators may give wrong signals. Machine learning algorithms can be introduced to assist in judging the reliability of indicator signals.
-
There are some overbought and oversold risks. Indicator parameters can be adjusted accordingly or more indicator logic can be added.
Optimization Directions
-
Add adaptive indicator parameter functionality. Adjust indicator parameters in real time based on market volatility and change speed.
-
Add stop loss logic. Exit stop loss if losses exceed a certain percentage to effectively control single loss.
-
Incorporate sentiment indicators. Increase multidimensional judgments such as market heat and market fear to improve strategy profit space.
Conclusion
By verifying signals through four major indicators, this strategy can effectively reduce the false signal rate and is a relatively stable high-frequency profit strategy. With continuous optimization of parameters and models, the strategy's win rate and profitability can be further improved.
/*backtest
start: 2023-11-29 00:00:00
end: 2023-12-06 00:00:00
period: 1m
basePeriod: 1m
exchanges: [{"eid":"Futures_Binance","currency":"BTC_USDT"}]
*/


//@version=5
strategy('John Day Stop Loss', overlay=false, pyramiding=1, default_qty_type=strategy.cash, default_qty_value=10000, initial_capital=10000, currency='USD', precision=2)
strategy.risk.allow_entry_in(strategy.direction.long) - 1