Double Rail Breakthrough Moving Average Crossover Strategy

Overview
The double rail breakthrough moving average crossover strategy is a trend-following quantitative trading strategy. The strategy uses a double rail mechanism to judge the market trend direction and combines moving average crossover signals to enter the market. Specifically, the strategy uses moving averages of different cycles to build a double rail and judges the trend by whether the price breaks through the upper or lower rail; then it combines fast and slow moving average crossover signals to filter entry timing.
Strategy Principle
The double rail breakthrough moving average crossover strategy consists of the following parts:
-
Trend judgement module: Use moving averages of different cycles to build a double rail. When the price breaks through the upper rail, it is judged as an uptrend. When it breaks through the lower rail, it is judged as a downtrend.
-
Entry module: Go long when the fast moving average crosses above the medium and long moving average, and go short when it crosses below. It also needs to determine the trend direction.
-
Exit module: Close positions when the fast moving average crosses below the medium and long moving average.
The strategy first uses the Trend Required parameter to set the required trend strength. When the price breaks through the upper or lower rail, a trend is determined to have formed. Thereafter, go long when the fast moving average crosses above the medium and long moving average; go short when the fast moving average crosses below. Use the fast moving average crossing below the medium and long moving average as the exit signal after entering.
In addition, the strategy also has stop loss and take profit modules. The specific parameters can be adjusted and optimized to control risks and profits.
Advantage Analysis
Compared with single rail or single moving average strategies, the double rail breakthrough moving average crossover strategy combines trend judgment and entry timing selection, which can better grasp the market rhythm. The specific advantages are:
-
The double rail setting can more accurately determine the trend and avoid missing opportunities.
-
The moving average crossover filter can reduce the probability of doing reverse operations due to false breakouts.
-
Risk and return can be optimized by adjusting parameters.
-
The strategy logic is simple and clear, easy to understand and track.
Risk Analysis
The double rail breakthrough moving average crossover strategy also has some risks, mainly:
-
The double rail setting still cannot completely eliminate the probability of trend misjudgment.
-
Improper setting of moving average parameters may lead to excessively high trading frequency or reverse operations.
-
Overly loose stop loss points cannot effectively control single loss.
The corresponding solutions are:
-
Adjust double rail parameters appropriately to widen breakout judgment range.
-
Optimize moving average cycle portfolio to ensure reasonable trading frequency.
-
Test different levels of stop loss points to find optimal parameters.
Optimization Directions
The double rail breakthrough moving average crossover strategy also has the following optimizable directions:
-
Test different moving average cycle parameters to find optimal portfolio.
-
Try adding more moving averages to build a multi-moving average filtering system.
-
Test different stop loss algorithms, such as trailing stop loss, oscillating stop loss, etc.
-
Add compounding mechanism to optimize capital utilization efficiency.
-
Combine with other indicators for filtering, such as Bollinger Bands, KDJ, etc.
Summary
The double rail breakthrough moving average crossover strategy comprehensively considers trend judgment and entry timing selection, which can effectively grasp the market rhythm. Compared with single indicators, this strategy has the advantages of more accurate judgment and better filtering. By optimizing parameters and upgrading modules, it is expected to further improve the stability and profitability of the strategy.
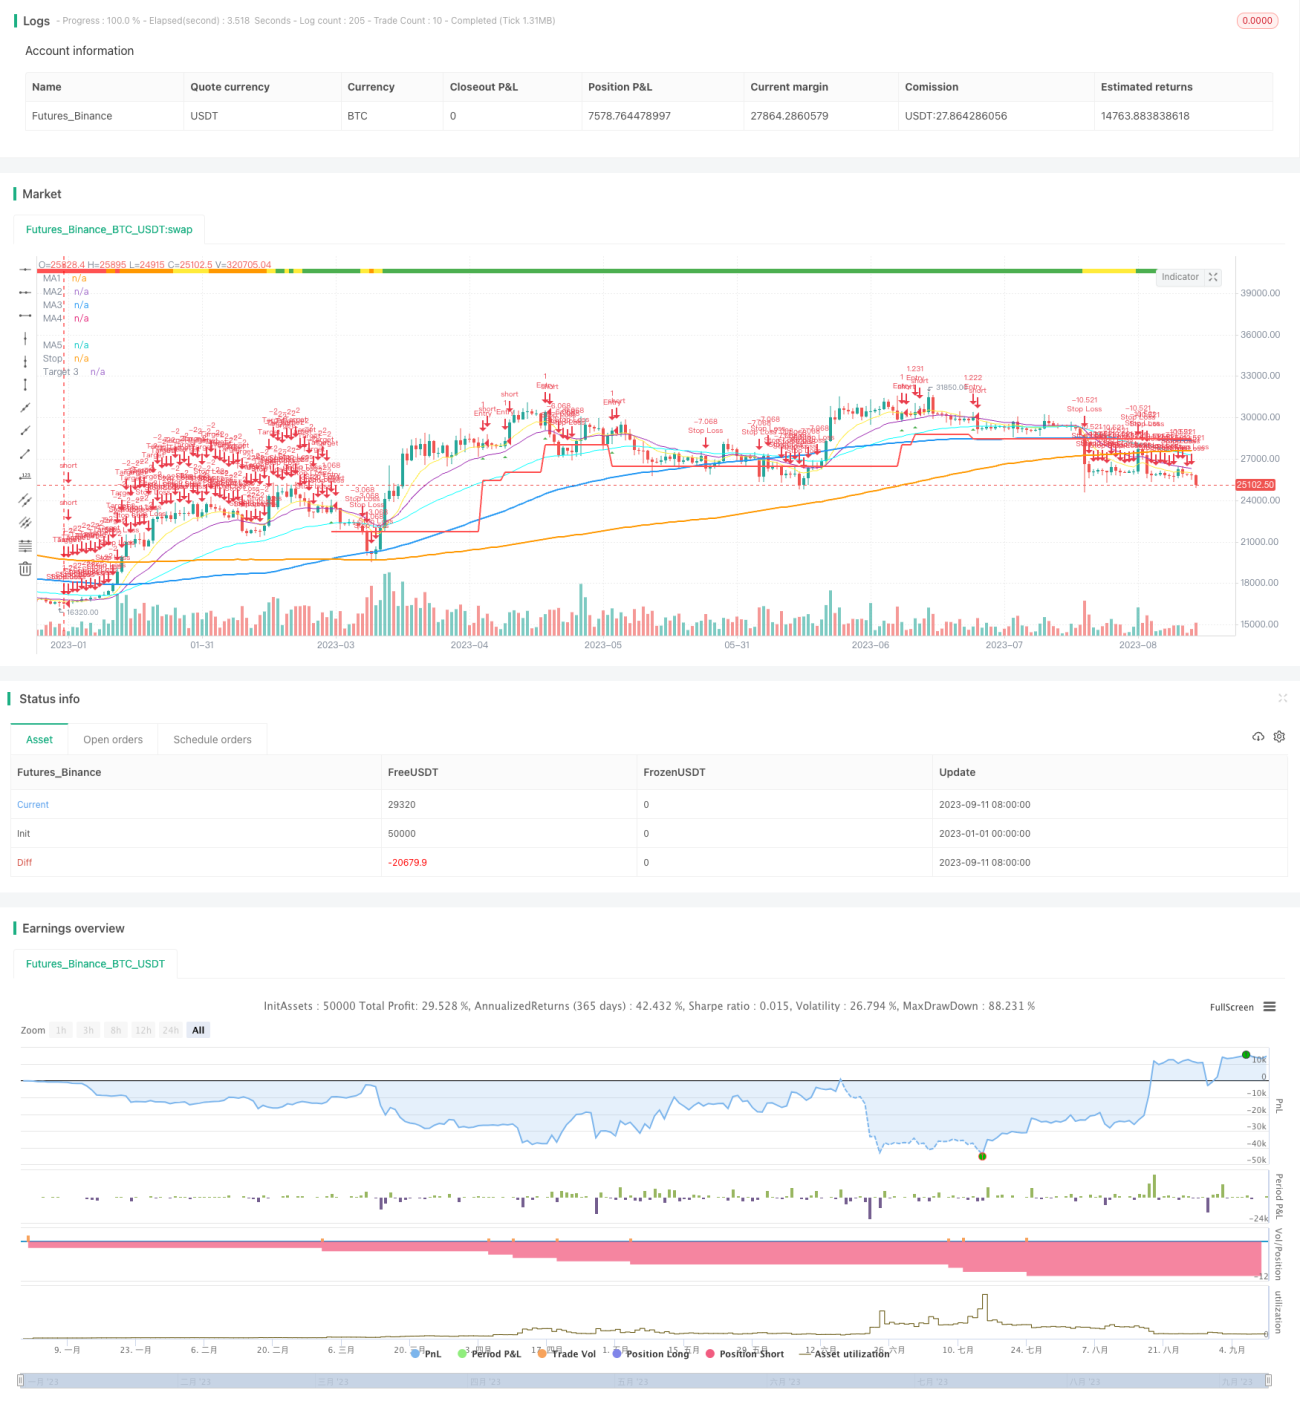
/*backtest
start: 2023-01-01 00:00:00
end: 2023-09-12 00:00:00
period: 1d
basePeriod: 1h
exchanges: [{"eid":"Futures_Binance","currency":"BTC_USDT"}]
*/

//@version=4
//Author = Dustin Drummond https://www.tradingview.com/u/Dustin_D_RLT/
//Strategy based in part on original 10ema Basic Swing Trade Strategy by Matt Delong: https://www.tradingview.com/u/MattDeLong/
//Link to original 10ema Basic Swing Trade Strategy: https://www.tradingview.com/script/8yhGnGCM-10ema-Basic-Swing-Trade-Strategy/- 1