概述
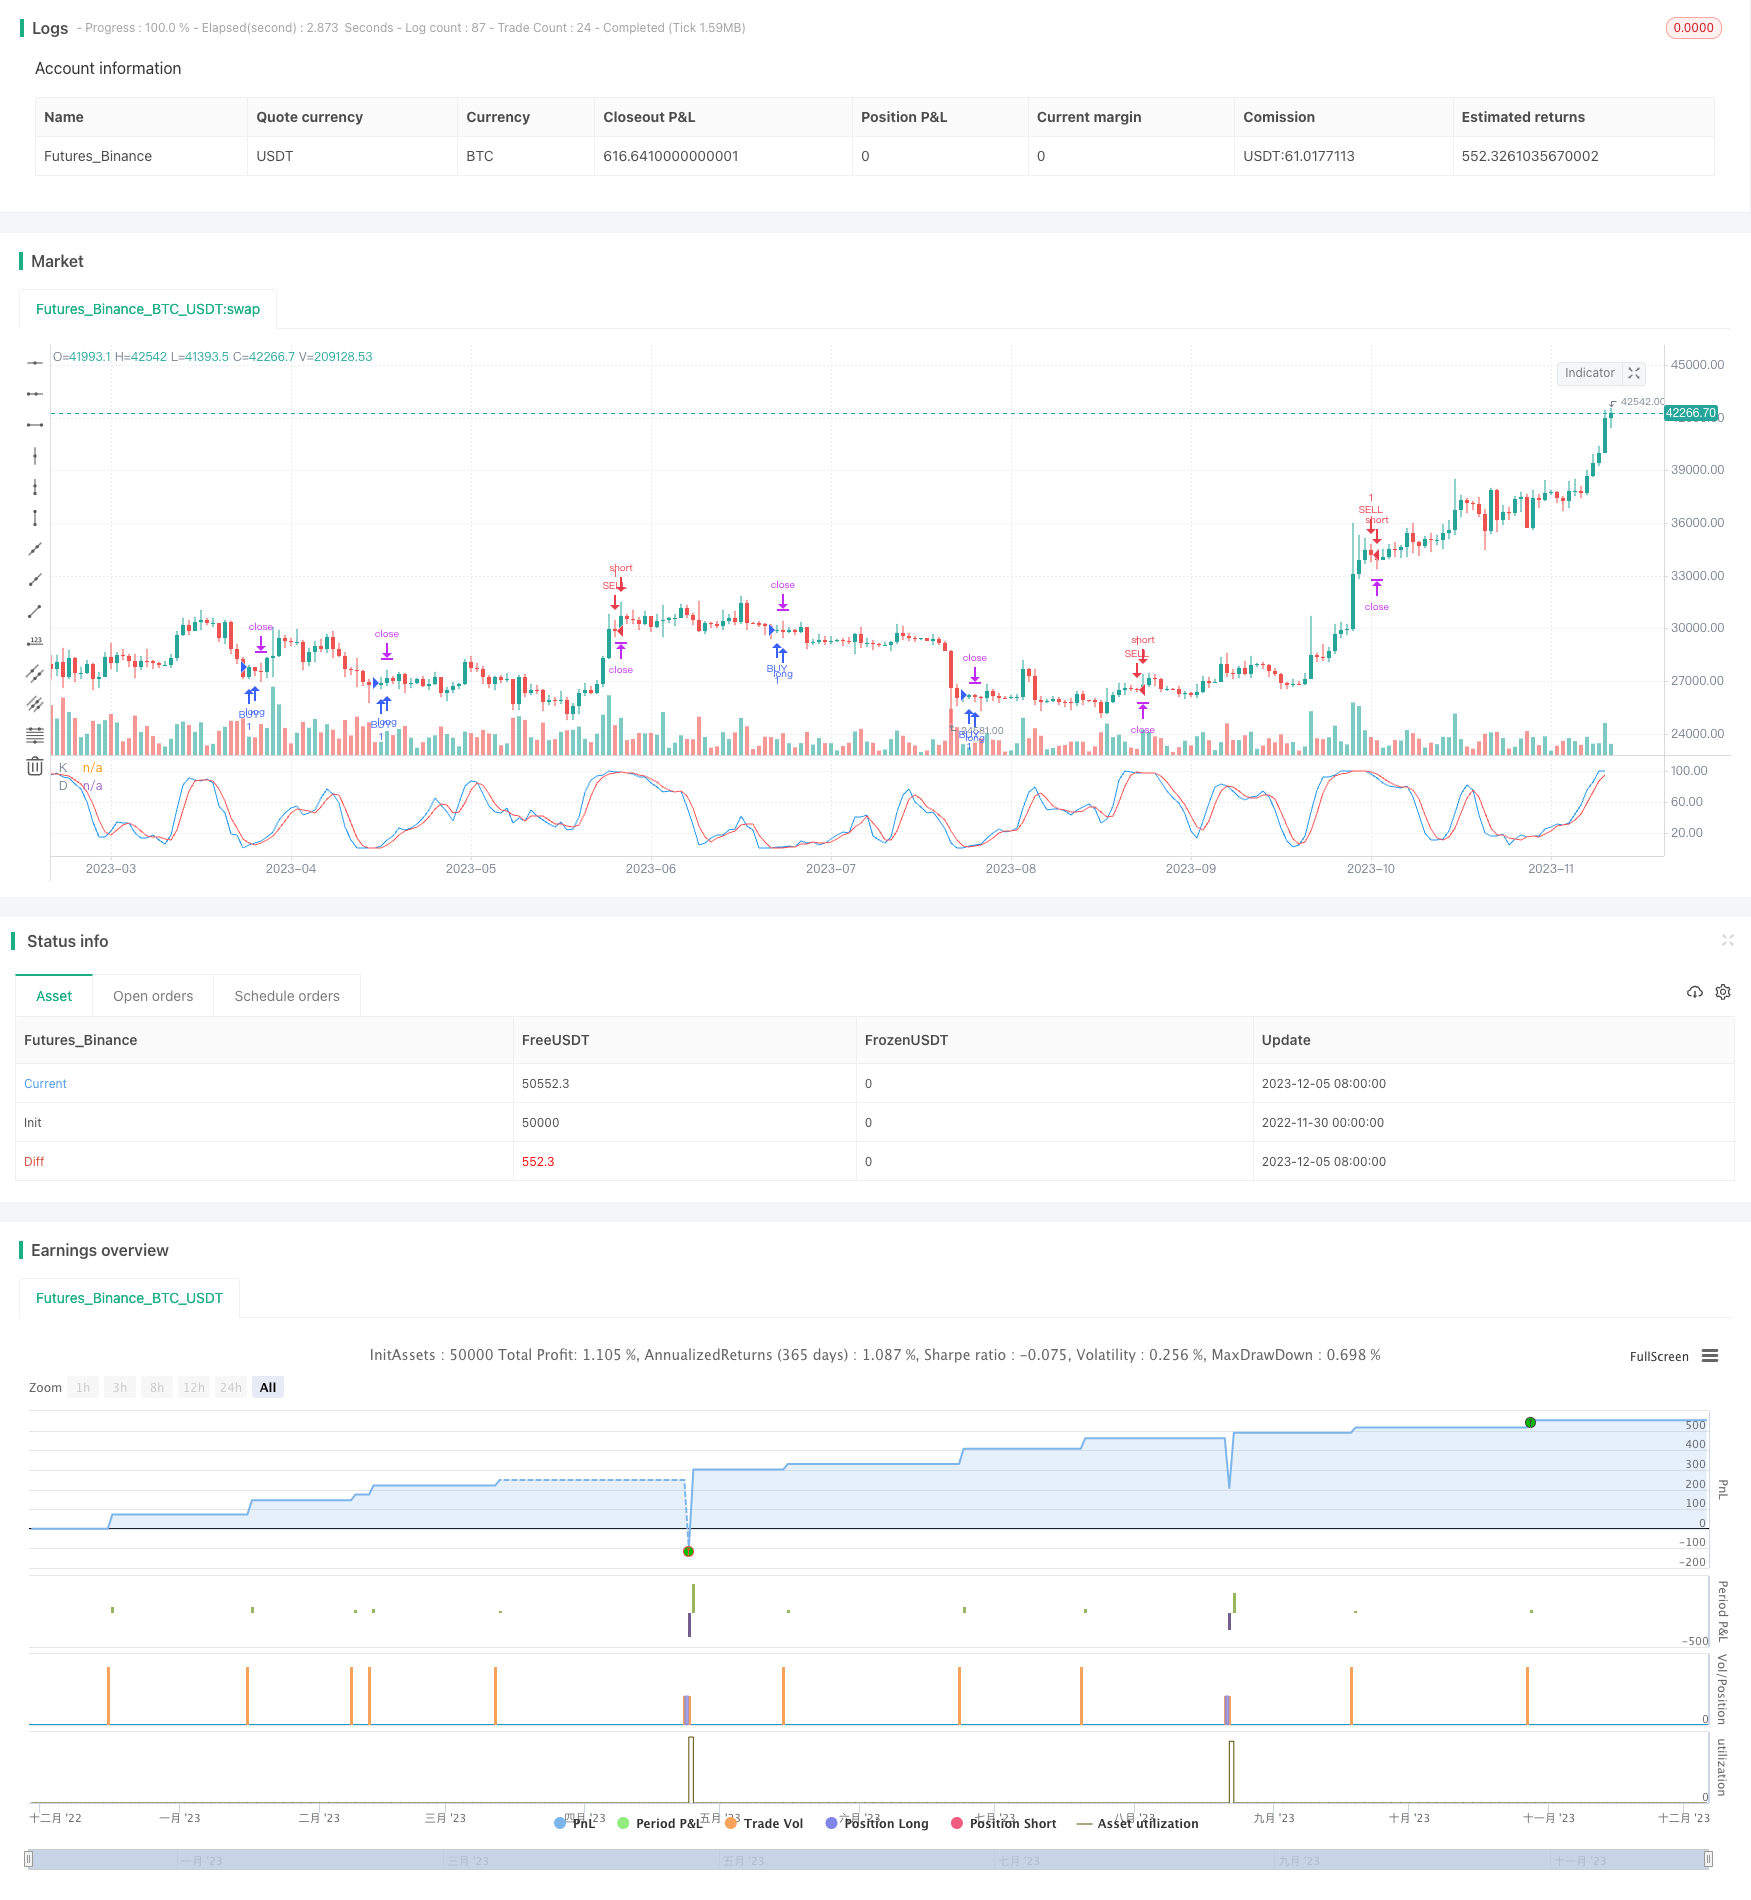
本策略基于StochRSI指标开发。该策略主要使用StochRSI指标判断超买超卖情况,结合RSI指标过滤掉一些虚假信号,在StochRSI指标显示超卖区域时做空,显示超卖区域时做多,实现获利。
策略原理
本策略主要应用StochRSI指标判断市场超买超卖区域。StochRSI指标由K线和D线组成,其中K线反映当前RSI的值在最近一段时期RSI价格范围中的位置,D线是K线的移动平均线。当K线上穿D线时为超卖区域,这时可以做多;当K线下穿D线时为超卖区域,这时可以做空。
具体来说,策略首先计算长度为14的RSI指标的值,然后在RSI指标上应用StochRSI指标。StochRSI指标参数设置长度为14,平滑周期K线为3,D线也为3。当K线上穿用户设定的超卖区域(默认为1)时,做多;当K线下穿用户设定的超卖区域(默认为99)时,做空。
此外,策略还设置了止损和止盈参数。止损参数默认为10000;止盈根据参数设置为曲线trailing stop,默认后踪点数为300,偏移量为0。
优势分析
- 使用StochRSI指标判断超买超卖区域,相比单一RSI指标更可靠
- 结合RSI过滤信号,避免虚假突破
- 设置止损止盈机制控制风险
风险分析
- StochRSI指标存在头假信号的可能
- 需要合理设置超买超卖参数,否则将误操作
- 止损点过小容易被套,止盈点过大可能获得收益有限
针对以上风险,可以设置更长的参数周期或考虑与其他指标组合使用来过滤信号,调整超买超卖参数适应不同市场,以及测试不同的止损止盈参数。
优化方向
- 可以考虑与其他指标组合使用,例如MACD、布林线等,用以过滤假信号
- 可以测试不同的参数周期设置,以适应更多市场情况
- 可以优化止损止盈点,在回测中多次测试,找到最优参数
总结
本策略基于StochRSI指标判断超买超卖区域进行交易。相比单一RSI指标,StochRSI结合KDJ的思想,能更准确判断转折点。同时结合RSI过滤假信号,并设置止损止盈控制风险。优化空间还很大,可与其他指标组合使用,或优化参数设置。
策略源码
/*backtest
start: 2023-11-06 00:00:00
end: 2023-12-06 00:00:00
period: 1h
basePeriod: 15m
exchanges: [{"eid":"Futures_Binance","currency":"BTC_USDT"}]
*/

//@version= 2
strategy("STOCHRSI JURE", overlay=false)
lengthrsi = input(10)
overSold = input( 1 )
overBought = input(99)

call_trail_stop = input(300)
call_trail_offset = input(0)
call_sl = input(10000)

price = ohlc4
vrsi = rsi(price, lengthrsi)

smoothK = input(3, minval=1)
smoothD = input(3, minval=1)
lengthRSI = input(14, minval=1)
lengthStoch = input(14, minval=1)
src = input(close, title="RSI Source")

rsi1 = rsi(src, lengthRSI)
k = sma(stoch(rsi1, rsi1, rsi1, lengthStoch), smoothK)
d = sma(k, smoothD)


plot( k, color=blue, linewidth=1, title="K")
plot( d, color=red, linewidth=1, title="D")

if (crossover(k, overSold) )
    strategy.entry("BUY", strategy.long, stop=close, oca_name="TREND",  comment="BUY")
    strategy.exit("BUY EXIT", "BUY", trail_points=call_trail_stop, trail_offset=call_trail_offset, loss = call_sl)


if (crossunder(k, overBought) )
    strategy.entry("SELL", strategy.short,stop=close, oca_name="TREND", comment="SELL")
    strategy.exit("SELL EXIT", "SELL", trail_points=call_trail_stop, trail_offset=call_trail_offset, loss = call_sl)


//if (  ( crossover(k,d)) and ( (vrsi<overSold) or crossover(vrsi,overSold) )  and   year >= yearfrom and year <= yearuntil and month>=monthfrom and month <=monthuntil and dayofmonth>=dayfrom and dayofmonth < dayuntil)
//    strategy.entry("BUY", strategy.long, stop=close, oca_name="TREND", oca_type=strategy.oca.cancel, comment="BUY")
//else
//    strategy.cancel(id="BUY")

//if ( ( crossunder(k,d) ) and ( (vrsi >overBought) or crossunder(vrsi,overBought) ) and   year >= yearfrom and year <= yearuntil and month>=monthfrom and month <=monthuntil and dayofmonth>=dayfrom and dayofmonth < dayuntil )
//    strategy.entry("SELL", strategy.short,stop=close, oca_name="TREND", oca_type=strategy.oca.cancel, comment="SELL")
//else
//    strategy.cancel(id="SELL")