Fibonacci Zone DCA Strategy

Overview
This article mainly introduces a quantitative trading strategy based on Fibonacci Zones and DCA setup with ADX indicators. The strategy uses Fibonacci Zones to determine trend and volatility, combines with ADX indicators to measure trend strength, enters trades following the major trend direction in strong trending markets, avoids trading in sideways markets, to maximize profits while minimizing risks.
Principles
-
- Uses Fibonacci Zones formed with Donchian Channels to determine market trend direction. The zones divide into uptrend, ranging and downtrend zones.
-
- Uses ADX and DI indicators to measure trend strength and direction. ADX above 25 indicates a trending market.
-
- Enters long trades when price breaks into uptrend Fibonacci zone according to trend strength and direction. Add subsequent safety orders to average down.
-
- Sets initial stop loss based on entry price and safety order formula. Moves stop loss up to lock in profits.
-
- Exits strategy with profit target by percentage or touching price levels related to Fibonacci zone borders.
Advantages
-
Captures big trending moves while avoiding whipsaws in choppy markets.
-
Fibonacci zones work as dynamic support/resistance levels to identify turning points.
-
DCA allows better entries and maximizes profit potential from trends.
-
ADX gauges trend strength to avoid bad trades. DI shows bullish/bearish bias.
-
All components like TP, SO and SL prices update dynamically and automatically.
Risks
-
ADX and DI can give false signals without additional indicator confirmation.
-
Areas in Fibonacci zones are subjective and may miss opportunities.
-
DCA fails if the price trends strongly against position before SO triggered.
-
Trail stop or profit target may exit before reaching full potential.
-
Backtest bias and curve fitting risks may not replicate live performance.
Enhancements
-
Add more indicators like RSI, stochastics to confirm signals.
-
Optimize ADX and Fibonacci input parameters for better performance.
-
Experiment with more intelligent trailing stop loss algorithms.
-
Expand testing on more symbols and timeframes to ensure robustness.
-
Use machine learning predictions for dynamic stop loss and take profit.
Conclusion
This strategy combines Fibonacci statistics and indicators like ADX for identifying high probability setups to go long or avoid trading altogether. The dynamic DCA position sizing ensures good entries while managing risks. With further optimizations, it has the potential to be a robust mechanical trading system. We look forward to more advanced versions in future.
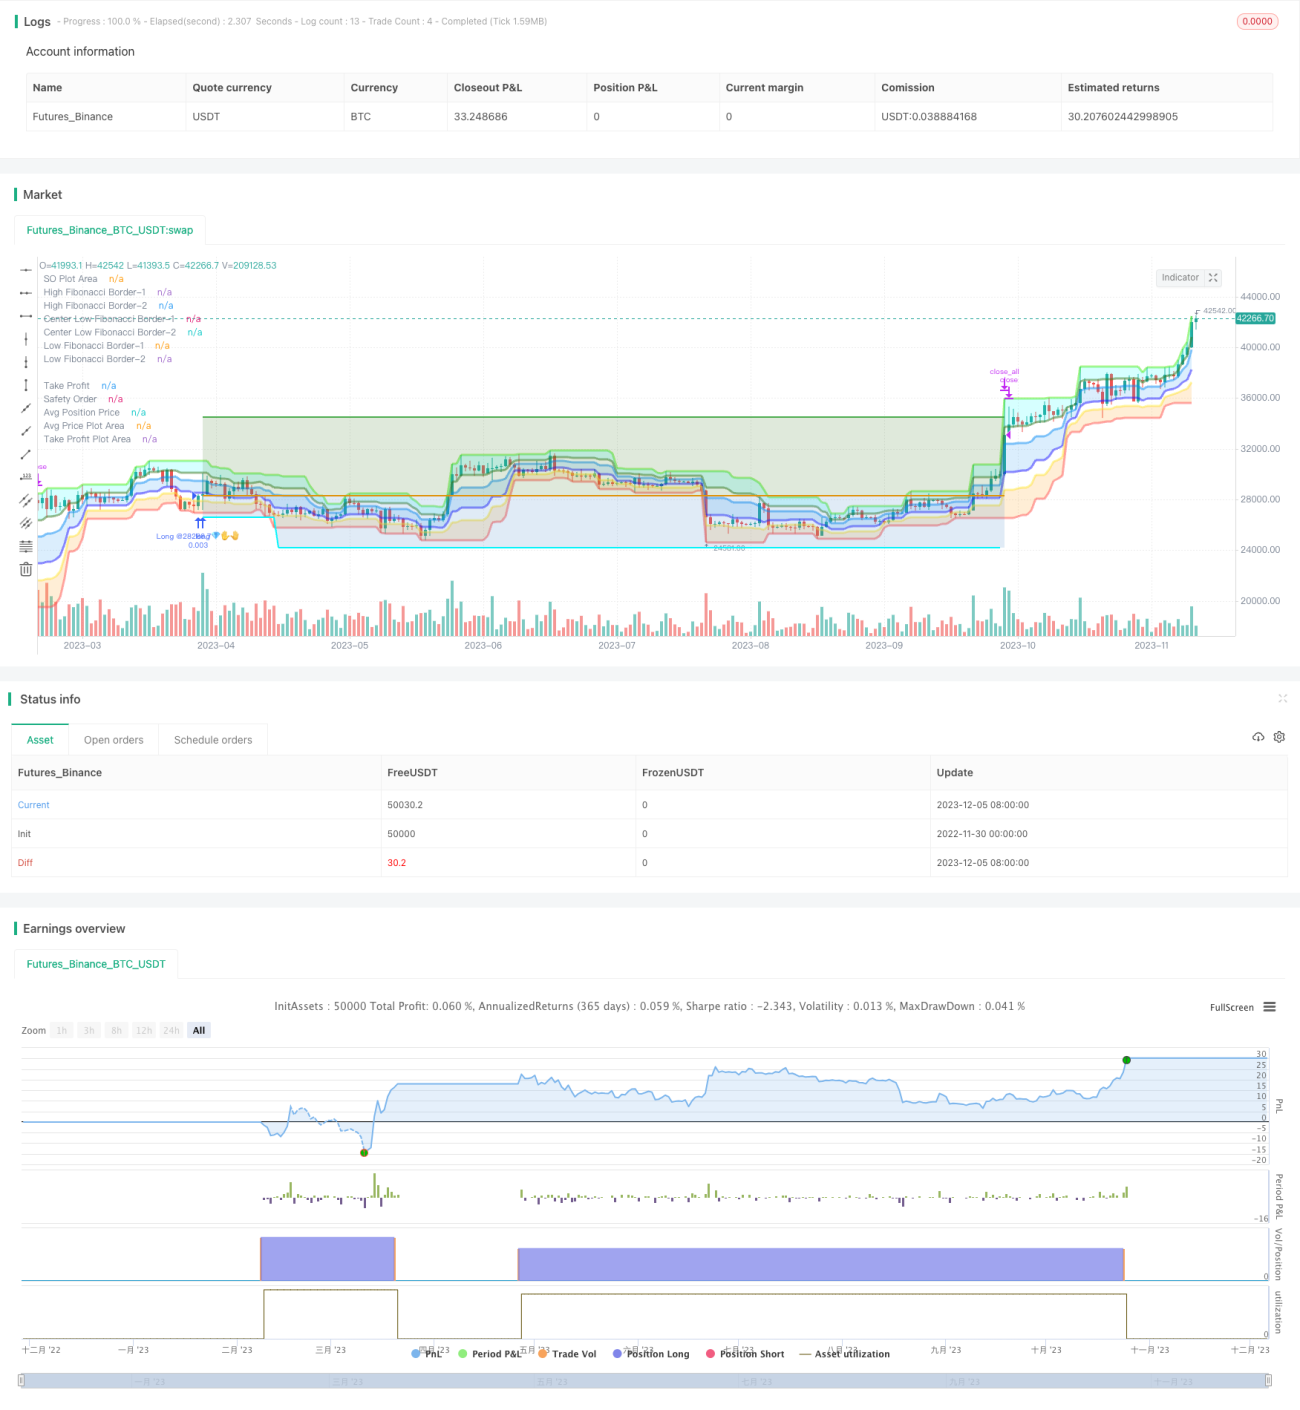
/*backtest
start: 2022-11-30 00:00:00
end: 2023-12-06 00:00:00
period: 1d
basePeriod: 1h
exchanges: [{"eid":"Futures_Binance","currency":"BTC_USDT"}]
*/

// © Fibonacci Zone DCA Strategy - R3c0nTrader ver 2022-06-12
// For backtesting with 3Commas DCA Bot settings
// Thank you "eykpunter" for granting me permission to use "Fibonacci Zones" to create this strategy
// Thank you "junyou0424" for granting me permission to use "DCA Bot with SuperTrend Emulator" which I used for adding bot inputs, calculations, and strategy- 1