The Vortex Oscillator Trend Following Strategy

Overview
The Vortex Oscillator trend following strategy is a trend tracking strategy based on the Vortex Indicator. It uses moving averages of multiple timeframes to construct the Vortex Indicator to identify potential price trends, and combines with a shorter-period moving average as an auxiliary judgment to achieve low-risk trend tracking operations.
Strategy Principle
The core indicator of this strategy is the Vortex Indicator. The Vortex Indicator consists of short-term, medium-term and long-term moving averages of multiple timeframes. Specifically, the strategy uses moving averages of 6 days, 27 days, 72 days and 234 days. The short-term moving average reflects the latest trend of prices, while the long-term moving average reflects the long-term trend. The core logic of the indicator is that when the short-term moving average crosses above the long-term moving average, it indicates that the upside momentum is strengthening and it’s time to buy. When the short-term moving average crosses below the long-term moving average, it indicates that the upside momentum is weakening and we should sell.
The significant advantage of the Vortex Indicator is that it accurately judges trends and effectively filters out market noise. However, its reaction is not sensitive enough to capture turning points in a timely manner. Therefore, the strategy incorporates a more sensitive 6-day moving average to construct an auxiliary judgment indicator. Buy when both the Vortex Indicator and the auxiliary indicator cross above the zero line, and sell when both indicators cross below the zero line. This forms a multi-confirmation logic where the Vortex Indicator determines the trend direction and strength while the auxiliary indicator determines specific entry and exit points, which filters out false signals while improving the sensitivity of operations.
Advantage Analysis
The biggest advantage of this strategy is the accuracy of judgment and sensitivity of operations. The combination of the Vortex Indicator and auxiliary indicators achieves an organic unity of trend judgment and determination of specific entry/exit points while avoiding interference with each other. The multi-confirmation mechanism can effectively filter out market noise and avoid wrong trades. At the same time, the addition of the auxiliary indicator also ensures the sensitivity of the strategy's operations.
Compared with single indicator strategies, the advantage of this strategy is that it combines multiple indicators to achieve stronger capabilities in identifying and responding to market changes. Under an unchanged major trend, the strategy can achieve steady profits. When major trends change, the strategy can also respond quickly to reduce losses.
Risk Analysis
The main risks of this strategy come from improper parameter settings of indicators and the impact of extreme events. The parameters of moving averages need to balance sensitivity and noise interference resistance. Improper parameter settings will lead to abnormal strategy behavior. In addition, major events could also cause extreme price volatility that disables indicators, resulting in wrong trades.
To mitigate these risks, parameters should be optimized and backtested to stabilize indicator performance. Also, pay close attention to market impacts from major events, pause strategies when necessary to avoid mistakes during abnormal volatility periods. As prices trend down, gradually reducing positions is also an effective capital preservation measure.
Optimization Directions
The strategy can be optimized in the following aspects:
-
Optimize moving average parameters to improve indicator’s noise resistance and operation sensitivity. Try different parameter combinations for lengths to select smooth yet sensitive indicators.
-
Add stop loss mechanisms. Set stop loss points when prices break key support levels in unfavorable directions to avoid further losses.
-
Incorporate other indicator judgments to increase strategy stability, e.g. only taking signals when trading volumes amplify.
-
Use different parameter sets based on different market stages. For example, more aggressive parameters during bull markets, and more stable settings in bear markets.
Conclusion
The Vortex Oscillator Trend Following Strategy successfully combines trend judgment and execution through the Vortex Indicator determining price trend direction/strength and a sensitive short-term moving average pinpointing specific entry/exit timing. By optimizing parameters, adding stop losses, and introducing state mechanisms, the strategy has the potential to further enhance its risk resistance capabilities and achieve superior backtesting metrics and live performance.
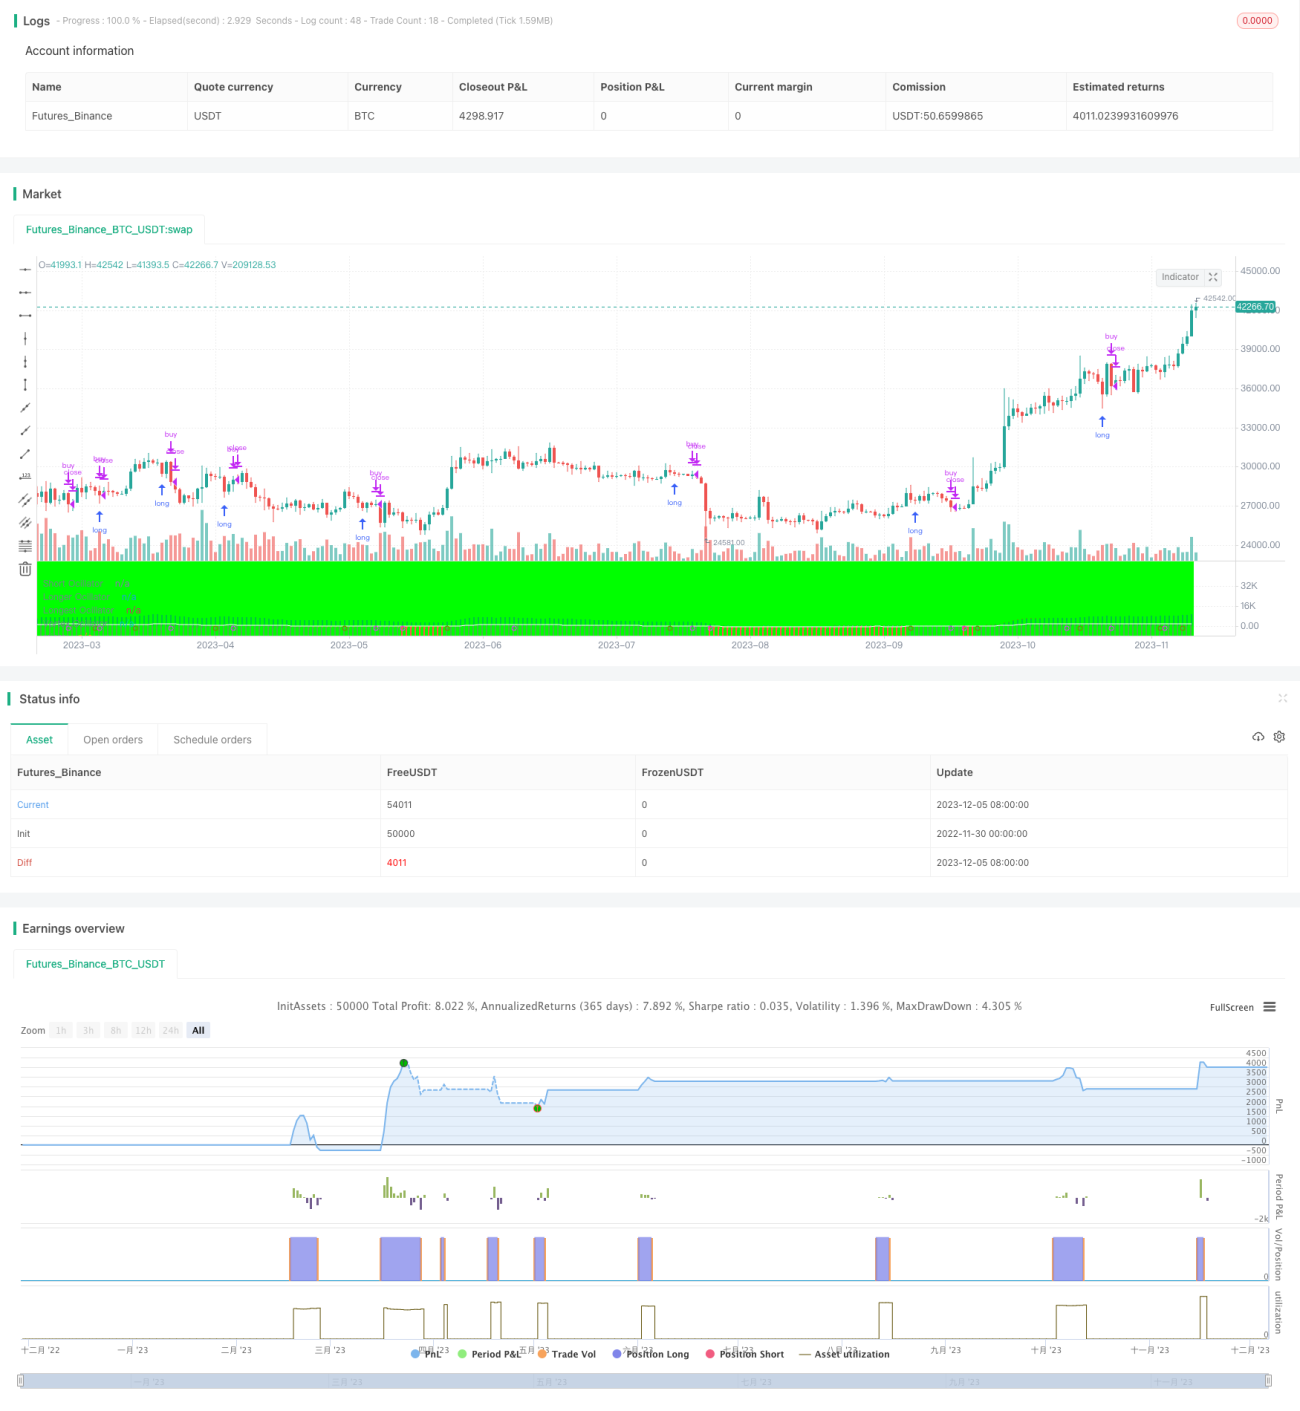
/*backtest
start: 2022-11-30 00:00:00
end: 2023-12-06 00:00:00
period: 1d
basePeriod: 1h
exchanges: [{"eid":"Futures_Binance","currency":"BTC_USDT"}]
*/

//@version=3
//swap strategy line for study line to enable backtesting
strategy(title="Vortex Ocillator" )
//study(title = "Vortex Oscillator", precision = 6)- 1