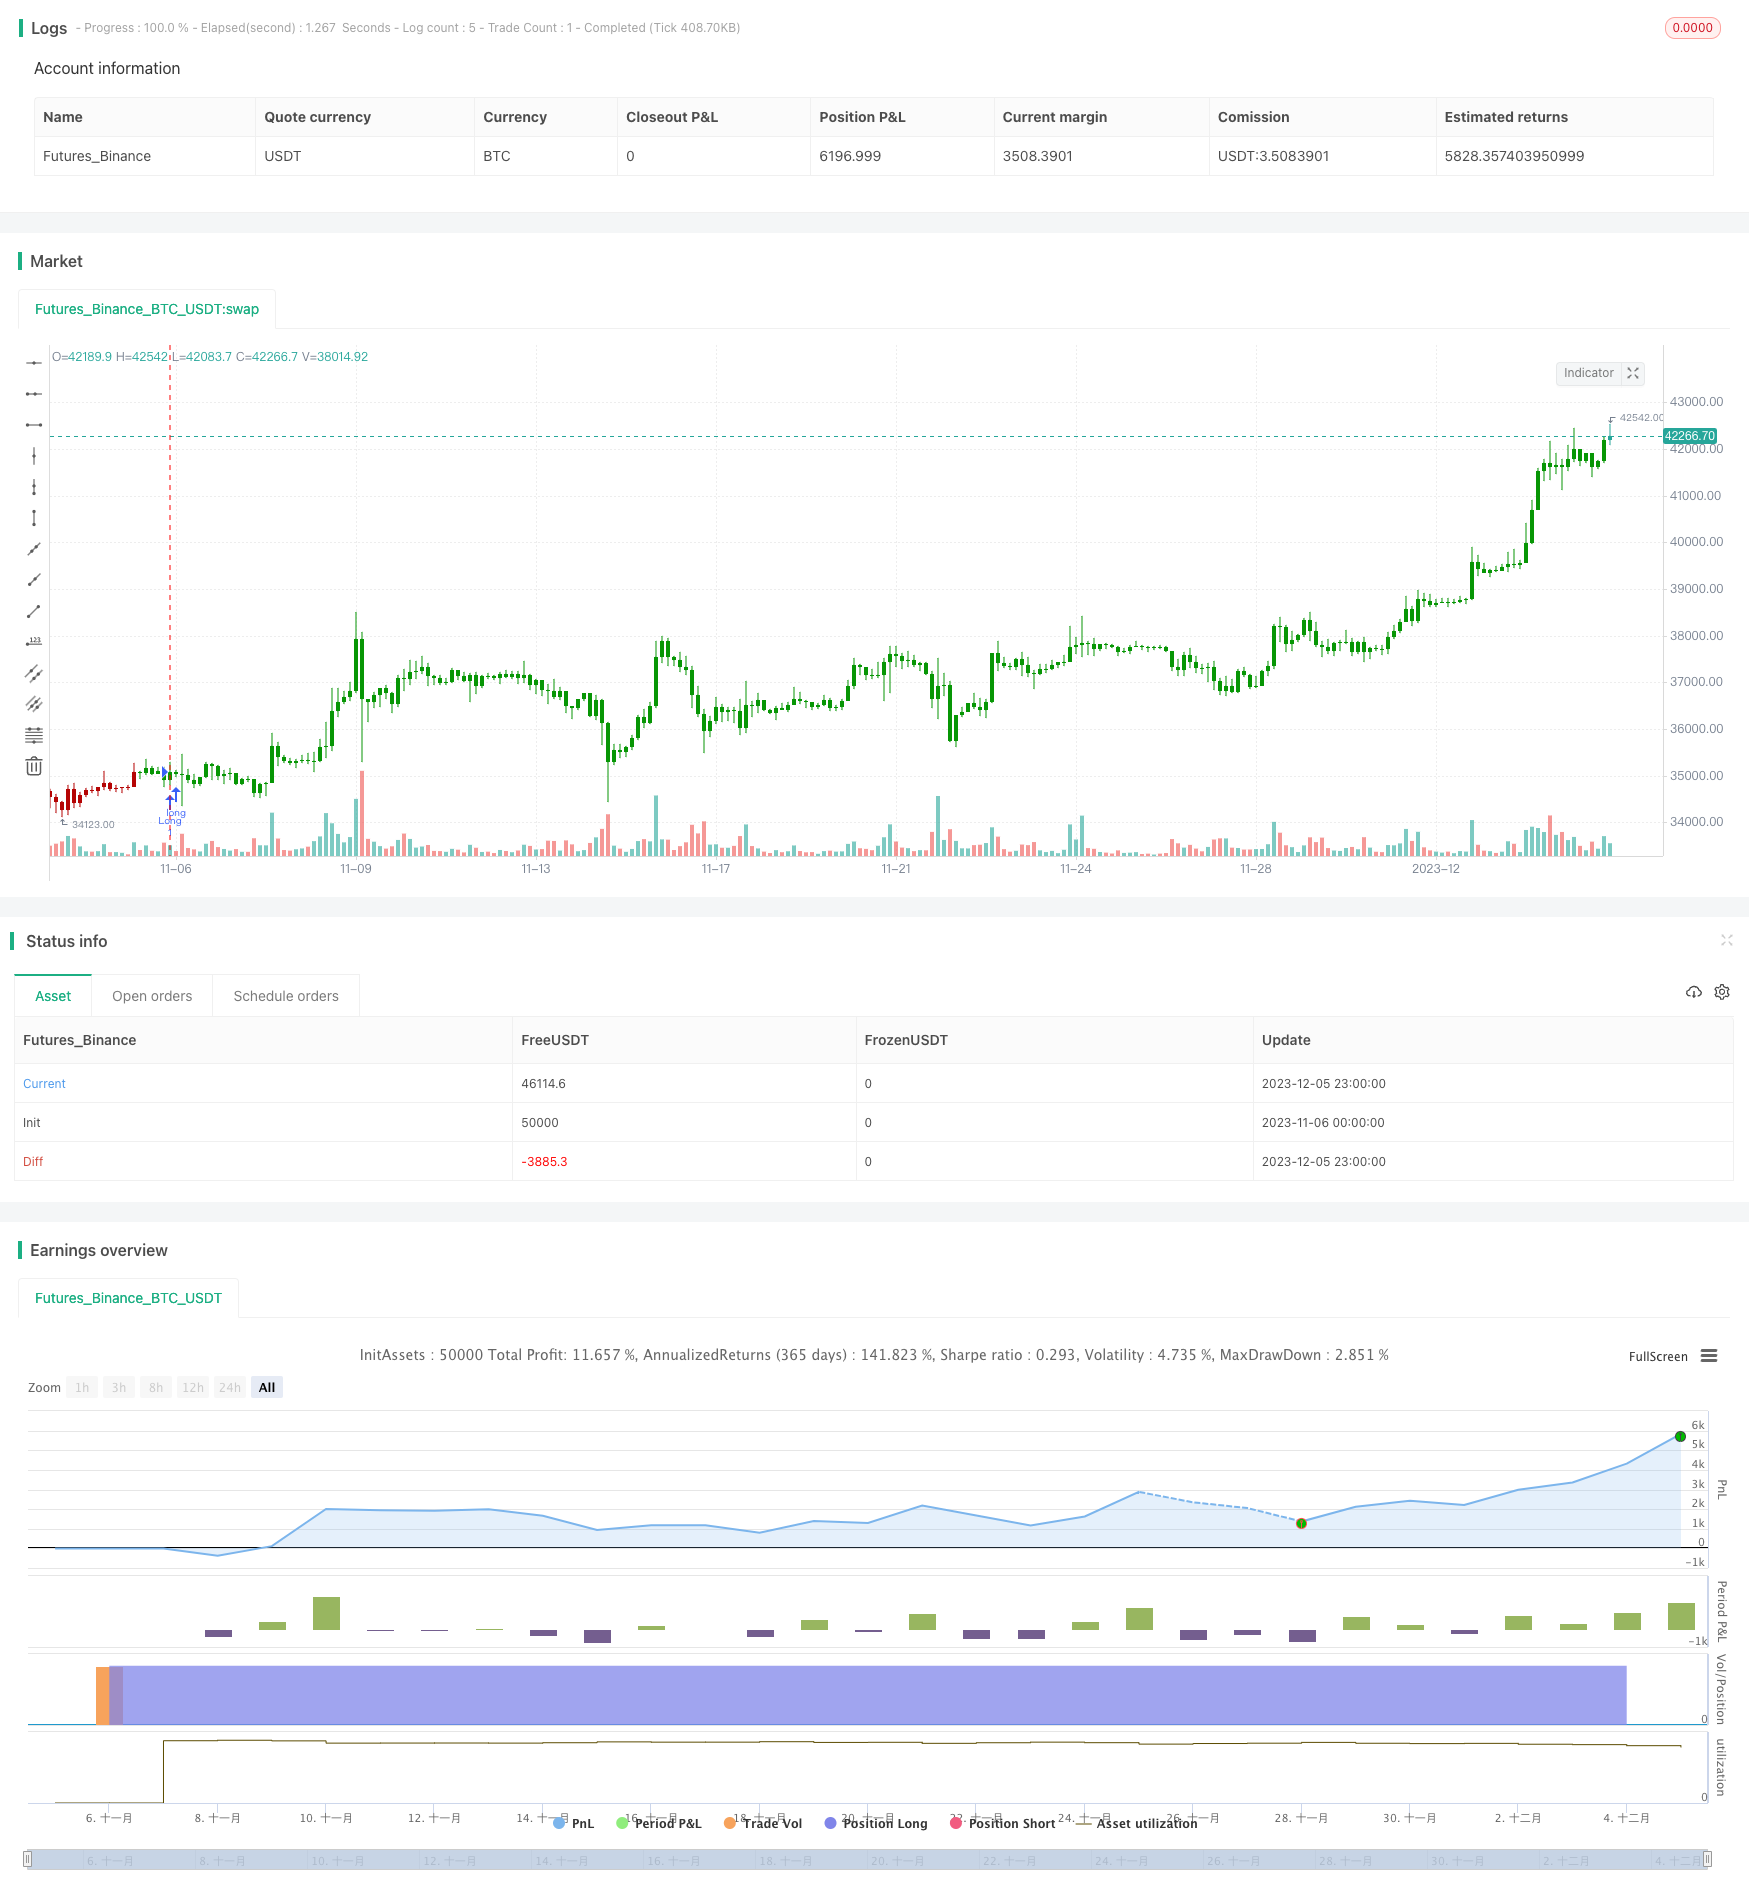
概述
该策略基于Camarilla支点的突破信号,结合RSI反转指标作为低吸机会,形成高级的动量反转型低吸策略。当价格突破Camarilla支点时产生交易信号,RSI低位则进一步确认吸筹机会,属于高级的动量反转策略。
策略原理
策略的核心信号来自于Camarilla支点。Camarilla支点基于昨日价格范围计算,分为S1到S5支点和R1到R5支点。当价格从S1支点向上突破时产生买入信号,当价格从R1支点向下突破时产生卖出信号。此外,结合RSI指标判断是否处于超卖状态,可以提高入场的成功率。
具体来说,策略首先根据昨日最高价、最低价以及收盘价,计算Camarilla支点。然后判断收盘价是否突破支点,以此产生交易信号。同时判断RSI指标是否处于低位,低于30视为超卖。只有收盘价突破支点并且RSI低于30,才会产生真正的交易信号。做多信号为向上突破S1支点,做空信号为向下突破R1支点。
举例来说,如果昨日价格在10-11之间波动,今日收盘价突破11.05(S1支点),同时RSI指标显示20,则产生买入信号。如果今日收盘价突破10.95(R1支点),RSI显示20,则产生卖出信号。因此,该策略融合了突破信号和超卖信号的优点。
优势分析
该策略最大的优势在于识别超跌和反转机会。Camarilla支点本身会把握价格的重要支持和阻力点。结合RSI指标判断反转时机,可以精确定位底部,避免追涨杀跌。这属于比较高级的突破策略。
另外,支点是动态计算的,会及时跟进价格变化。不像传统技术指标,需要设置参数。策略继承了支点分析的优势,更加灵活。此外,反转机会比较明确,不会出现频繁的虚假信号。
风险分析
该策略最大的风险在于,价格可能假突破。尽管结合RSI指标来确认超卖状态,但是价格突破支点后仍有可能出现反转。这会导致止损被击穿。
另一个风险是,RSI指标发生失效。即使出现超跌,但是RSI未降到30以下。这时并没有形成交易信号,会错过反转机会。针对这一风险,可以适当优化RSI的参数设置。
优化方向
该策略可以通过以下几个方面进行优化:
优化RSI的参数。可以测试不同的超卖线,是30好还是20更合适。
增加其他指标进行组合。比如KDJ指标,可以进一步确认反转信号的可靠性。
测试不同的Camarilla支点。可以只使用S1和R1,减少假突破的概率。
优化止损策略。可以根据ATR指标设置止损位,或者追踪突破的支点作为止损位。
测试不同的品种合约。适用于股指、外汇、商品等不同品种。参数需要调整。
总结
该策略属于高级的动量反转型突破策略。通过Camarilla支点判断突破信号,RSI指标确定超卖状态。策略优势在于识别反转机会,最大的风险是价格假突破。通过参数优化以及风险管理,可以进一步提高策略的稳定性和盈利能力。
/*backtest
start: 2023-11-06 00:00:00
end: 2023-12-06 00:00:00
period: 3h
basePeriod: 15m
exchanges: [{"eid":"Futures_Binance","currency":"BTC_USDT"}]
*/

//@version=4
////////////////////////////////////////////////////////////
//  Copyright by HPotter v1.0 07/05/2020
// Pivot point studies highlight prices considered to be a likely turning point
// when looking at values from a previous period, whether it be daily, weekly,
// quarterly or annual. Each pivot point study has its own characteristics on
// how these points are calculated.
//
// Red color = Sell
// Green color = Buy
//
// WARNING:
//  - For purpose educate only
//  - This script to change bars colors.
////////////////////////////////////////////////////////////
strategy(title="Camarilla Pivot Points Backtest", shorttitle="CPP", overlay = true)
res = input(title="Resolution", type=input.resolution, defval="D")
SellFrom = input(title="Sell from ", defval="R1", options=["R1", "R2", "R3", "R4", "R5"])
BuyFrom = input(title="Buu from ", defval="S1", options=["S1", "S2", "S3", "S4", "S5"])
reverse = input(false, title="Trade reverse")
xHigh  = security(syminfo.tickerid,res, high)
xLow   = security(syminfo.tickerid,res, low)
xClose = security(syminfo.tickerid,res, close)
xXLC3 = (xHigh+xLow+xClose) / 3
xRange = xHigh-xLow
S1 = xClose - xRange * (1.1 / 12)
S2 = xClose - xRange * (1.1 / 6)
S3 = xClose - xRange * (1.1 / 4)
S4 = xClose - xRange * (1.1 / 2)
R1 = xClose + xRange * (1.1 / 12)
R2 = xClose + xRange * (1.1 / 6)
R3 = xClose + xRange * (1.1 / 4)
R4 = xClose + xRange * (1.1 / 2)
R5 = (xHigh/xLow) * xClose
S5 = xClose - (R5 - xClose)
pos = 0
S = iff(BuyFrom == "S1", S1,
      iff(BuyFrom == "S2", S2,
       iff(BuyFrom == "S3", S3,
         iff(BuyFrom == "S4", S4,
          iff(BuyFrom == "S5", S5, 0)))))
B = iff(SellFrom == "R1", R1,
      iff(SellFrom == "R2", R2,
       iff(SellFrom == "R3", R3,
         iff(SellFrom == "R4", R4,
          iff(SellFrom == "R5", R5, 0)))))

pos := iff(close > B, 1,
       iff(close < S, -1, nz(pos[1], 0)))
possig = iff(reverse and pos == 1, -1,
          iff(reverse and pos == -1 , 1, pos))
if (possig == 1)
    strategy.entry("Long", strategy.long)
if (possig == -1)
    strategy.entry("Short", strategy.short)
if (possig == 0)
    strategy.close_all()
barcolor(possig == -1 ? #b50404: possig == 1 ? #079605 : #0536b3 )