Dual Moving Average Reversal Tracking Strategy

The main idea of this strategy is to use the golden cross and dead cross of moving averages as trading signals, combined with the price breakout of dual moving averages to make entries and stops. It generates a buy signal when the short period moving average crosses above the long period moving average; a sell signal is generated when the short period moving average crosses below the long period moving average. Thus the strategy has both trend following and mean reversion characteristics.
The detailed operating principles are as follows:
-
Calculate short period simple moving average (SMA) and long period simple moving average.
-
Compare if the price is above or below the moving averages. The price above the moving averages indicates long position, while the price below shows short position.
-
Go long when short SMA crosses above long SMA; go short when short SMA crosses below long SMA.
-
Switch between long and short positions.
The main advantages of this strategy are:
-
The dual moving average strategy combines both trend following and mean reversion, which takes advantage of tracking market trends and capturing reversal opportunities.
-
The golden cross and dead cross of moving averages have some persistence, which helps filter out false breakouts.
-
Based on the moving average theory, it is beneficial to lock in profits during trending and range-bound markets.
The main risks of this strategy are:
-
The dual moving average strategy is sensitive to parameters. Improper parameter settings may result in overtrading or missing opportunities.
-
Failed breakouts can lead to losses. Effective stops should be implemented to control risks.
-
Trend reversal is not guaranteed to succeed. The original trend may continue resulting in losses.
The main optimization directions:
-
Test and optimize the moving average parameters to find the best parameter combination.
-
Add a trend determination indicator to distinguish between trending and ranging markets.
-
Implement effective stop loss to control risks, such as trailing stop loss, stop order loss etc.
-
Combine with other indicators to improve strategy robustness.
In conclusion, as a dual moving average reversal tracking strategy, it takes both trend tracking and reversal trading into consideration. With proper parameter optimization and risk control, it can achieve good results. However, any strategy faces risks like directional mistakes, stop loss failure etc. Continuous testing and optimization are needed to adapt to changing markets.
/*backtest
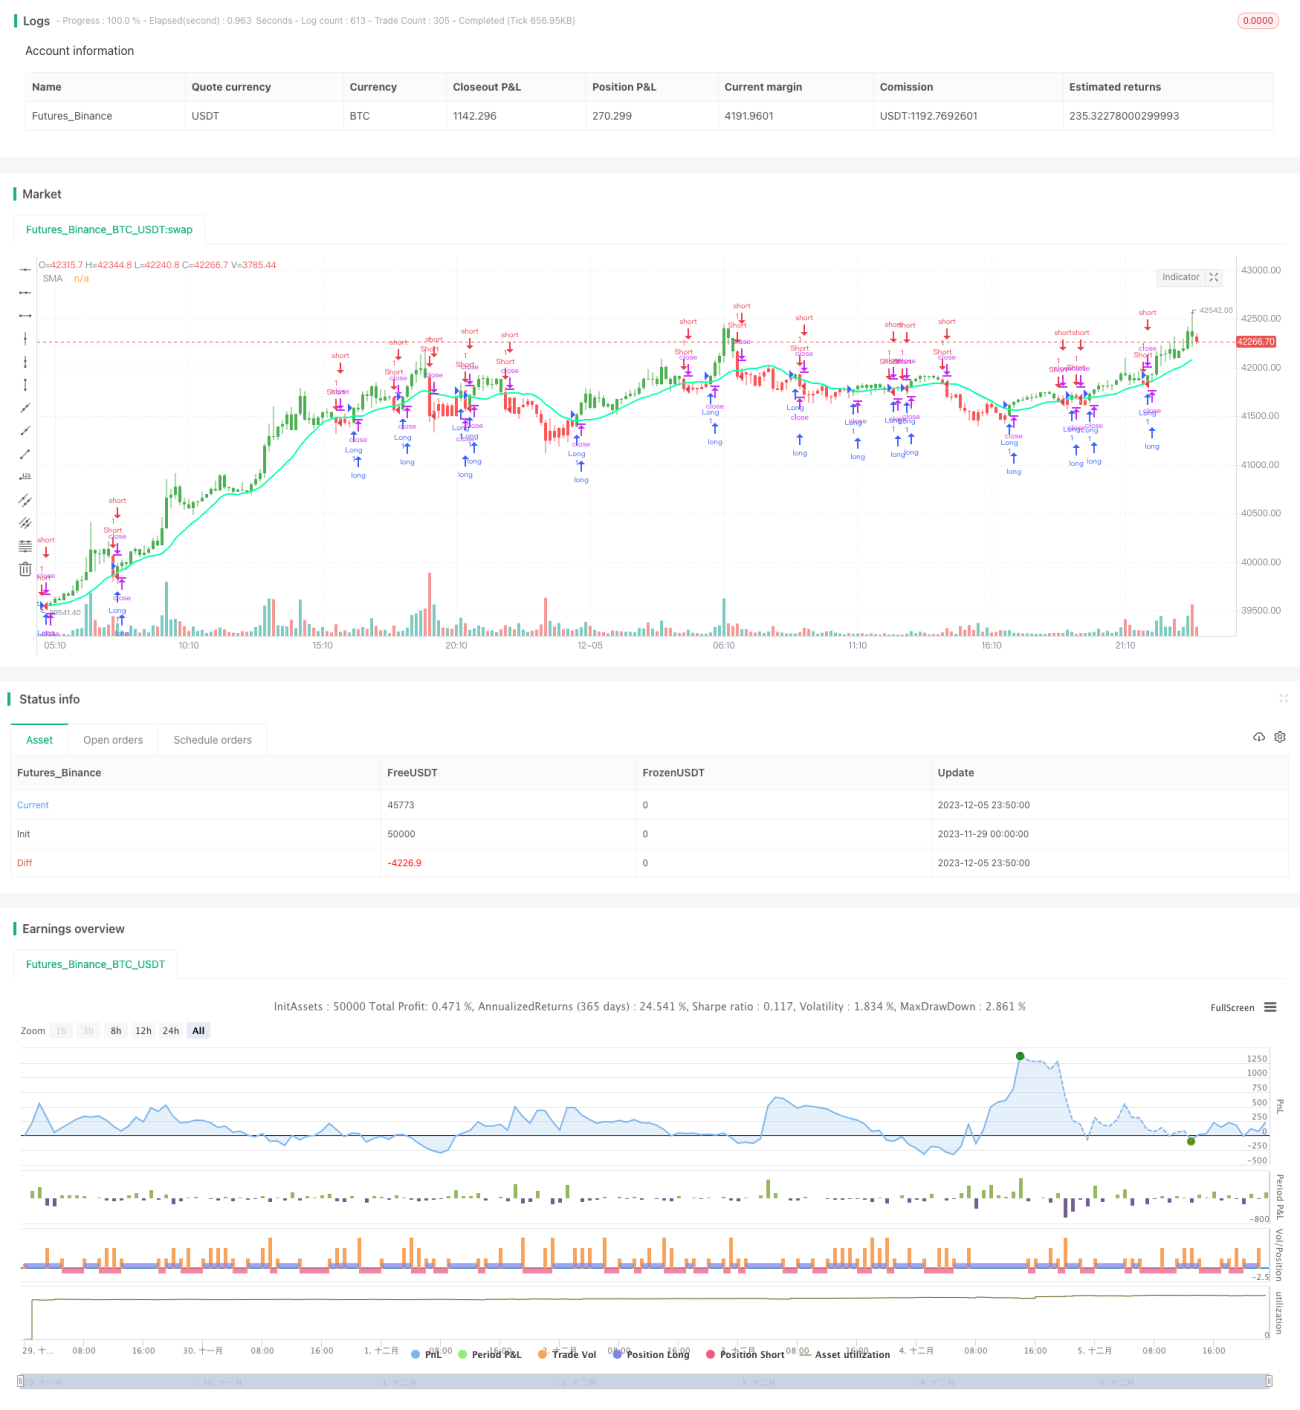
start: 2023-11-29 00:00:00
end: 2023-12-06 00:00:00
period: 10m
basePeriod: 1m
exchanges: [{"eid":"Futures_Binance","currency":"BTC_USDT"}]
*/
// This source code is subject to the terms of the Mozilla Public License 2.0 at https://mozilla.org/MPL/2.0/
// © HPotter
// Simple SMA strategy
//- 1