Moving Average Aggregation Williams Commercial Bid-Ask Pressure Indicator Strategy

The main idea of this strategy is to use the Williams Commercial Bid-Ask Pressure Indicator to judge the accumulation and distribution stages of the market, so as to discover the divergence between price and Williams Indicator and generate trading signals. When the security reaches a new high but the Williams Indicator does not reach a new high, it represents distribution by game participants and should sell. When the security reaches a new low but the Williams Indicator does not reach a new low, it represents accumulation by game participants and should buy.
The strategy principle is described in detail as follows:
This strategy is based on the Williams Commercial Bid-Ask Pressure Indicator, which reflects the buying and selling pressure in the market and judges whether the market is controlled by buyers or sellers. The Williams Indicator calculates the accumulation and distribution of prices based on the closing price, highest price and lowest price. When the price reaches a new high but the Williams Indicator does not reach a new high, it represents distribution and should sell. When the price reaches a new low but the Williams Indicator does not reach a new low, it represents accumulation and should buy.
This strategy uses the Williams Indicator to judge the accumulation and distribution of the market in order to discover price divergence and generate trading signals. At the same time, it uses moving averages to smooth the Williams Indicator to avoid false signals. When the Williams Indicator is above its moving average, it is in an accumulation stage. When below the moving average, it is in a distribution stage. When divergence occurs, go long in accumulation stage and go short in distribution stage.
The main advantages of this strategy are:
-
Accurately judge the buying and selling pressure in the market and capture inflection points of price trends.
-
Use moving averages to smooth the indicator curve and avoid false signals.
-
The rules are clear and easy to understand and implement.
-
Flexible parameter adjustment adaptable to different market environments.
The main risks and solutions are:
-
Williams Indicator may generate false signals. Moving averages can alleviate this to some extent.
-
Improper parameter settings may miss price reversals or generate false signals. Parameters should be adjusted to adapt to different cycles.
-
Pay attention to the impact of sudden events on prices and suspend trading plans if necessary.
The main directions for optimizing this strategy are:
-
Test more parameter combinations to find the optimal parameters.
-
Add other technical indicators for combination to improve signal accuracy.
-
Add stop loss strategies to reduce single loss.
-
Optimize entry timing to enter after trend becomes more obvious.
In summary, this strategy uses the Williams Commercial Bid-Ask Pressure Indicator to judge the willingness of market participants, combined with moving averages to discover price divergence, thus generating trading signals. This strategy is easy to understand and implement, adaptable to different markets through parameter adjustment, and can be optimized in many ways, worth in-depth research and application.
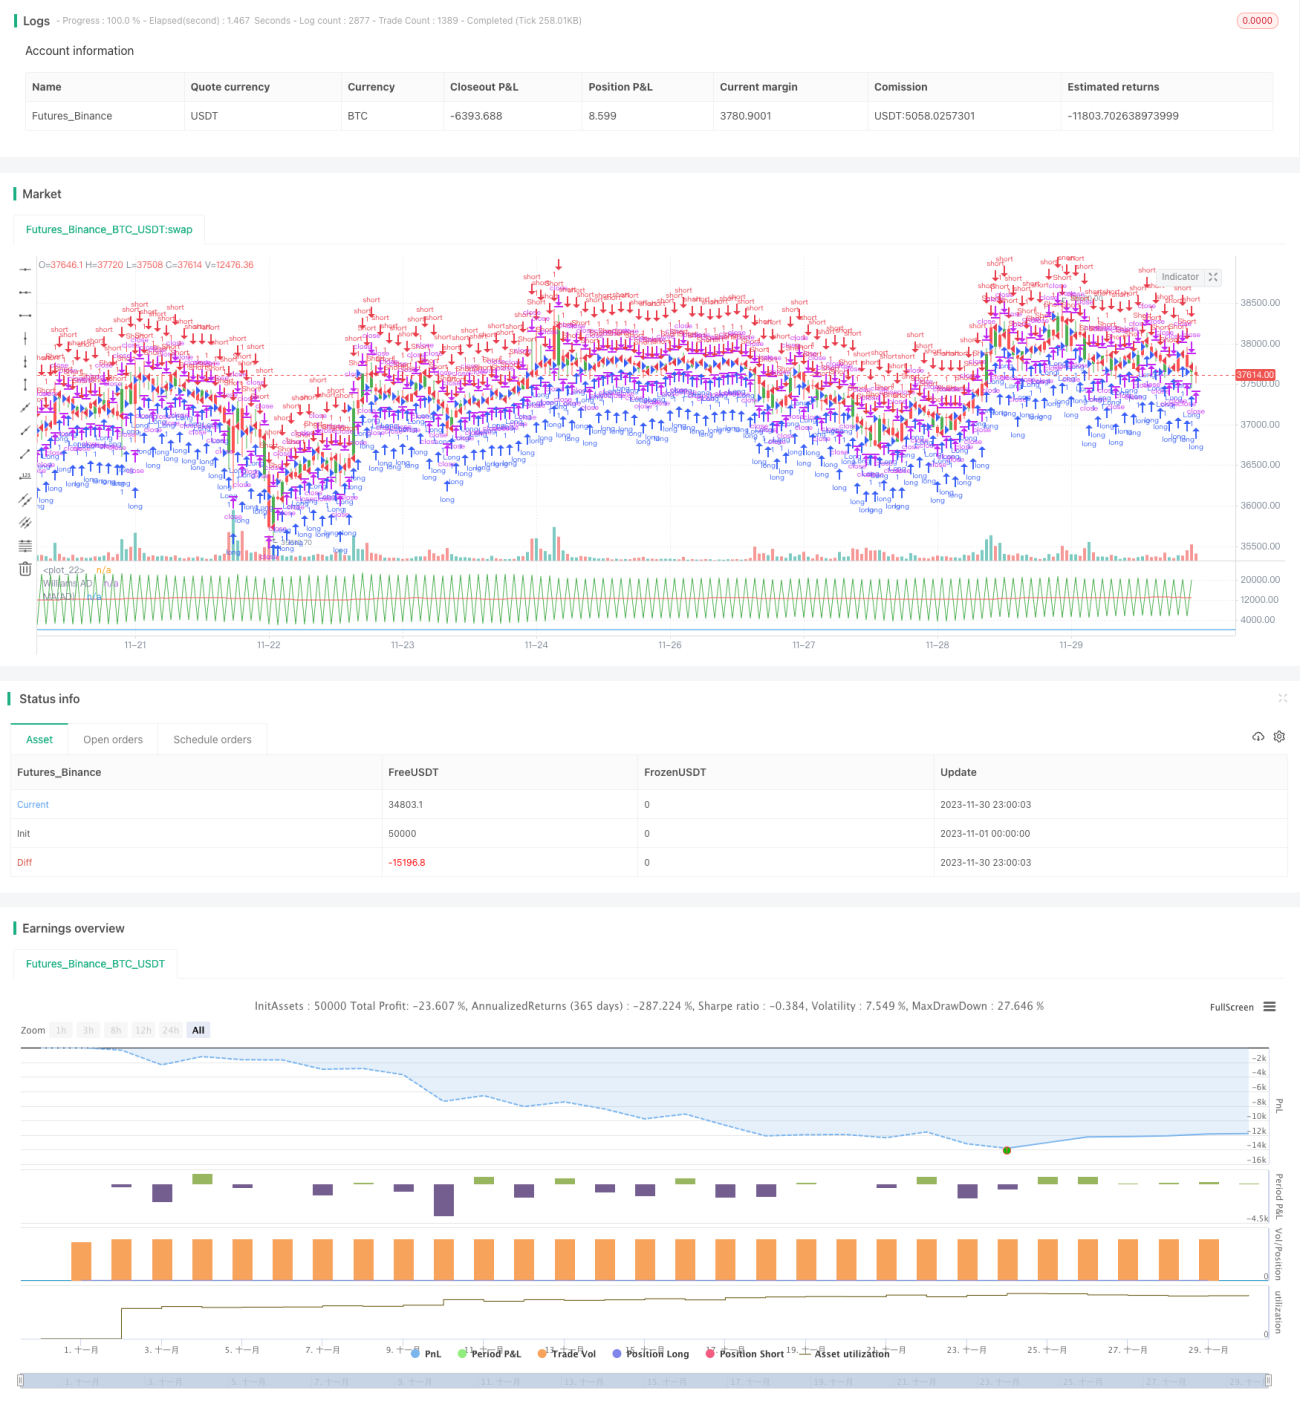
/*backtest
start: 2023-11-01 00:00:00
end: 2023-11-30 23:59:59
period: 1h
basePeriod: 15m
exchanges: [{"eid":"Futures_Binance","currency":"BTC_USDT"}]
*/

//@version=2
////////////////////////////////////////////////////////////
//  Copyright by HPotter v1.0 23/01/2018
// Accumulation is a term used to describe a market controlled by buyers;- 1