Moving Average Pullback Trading Strategy

Overview
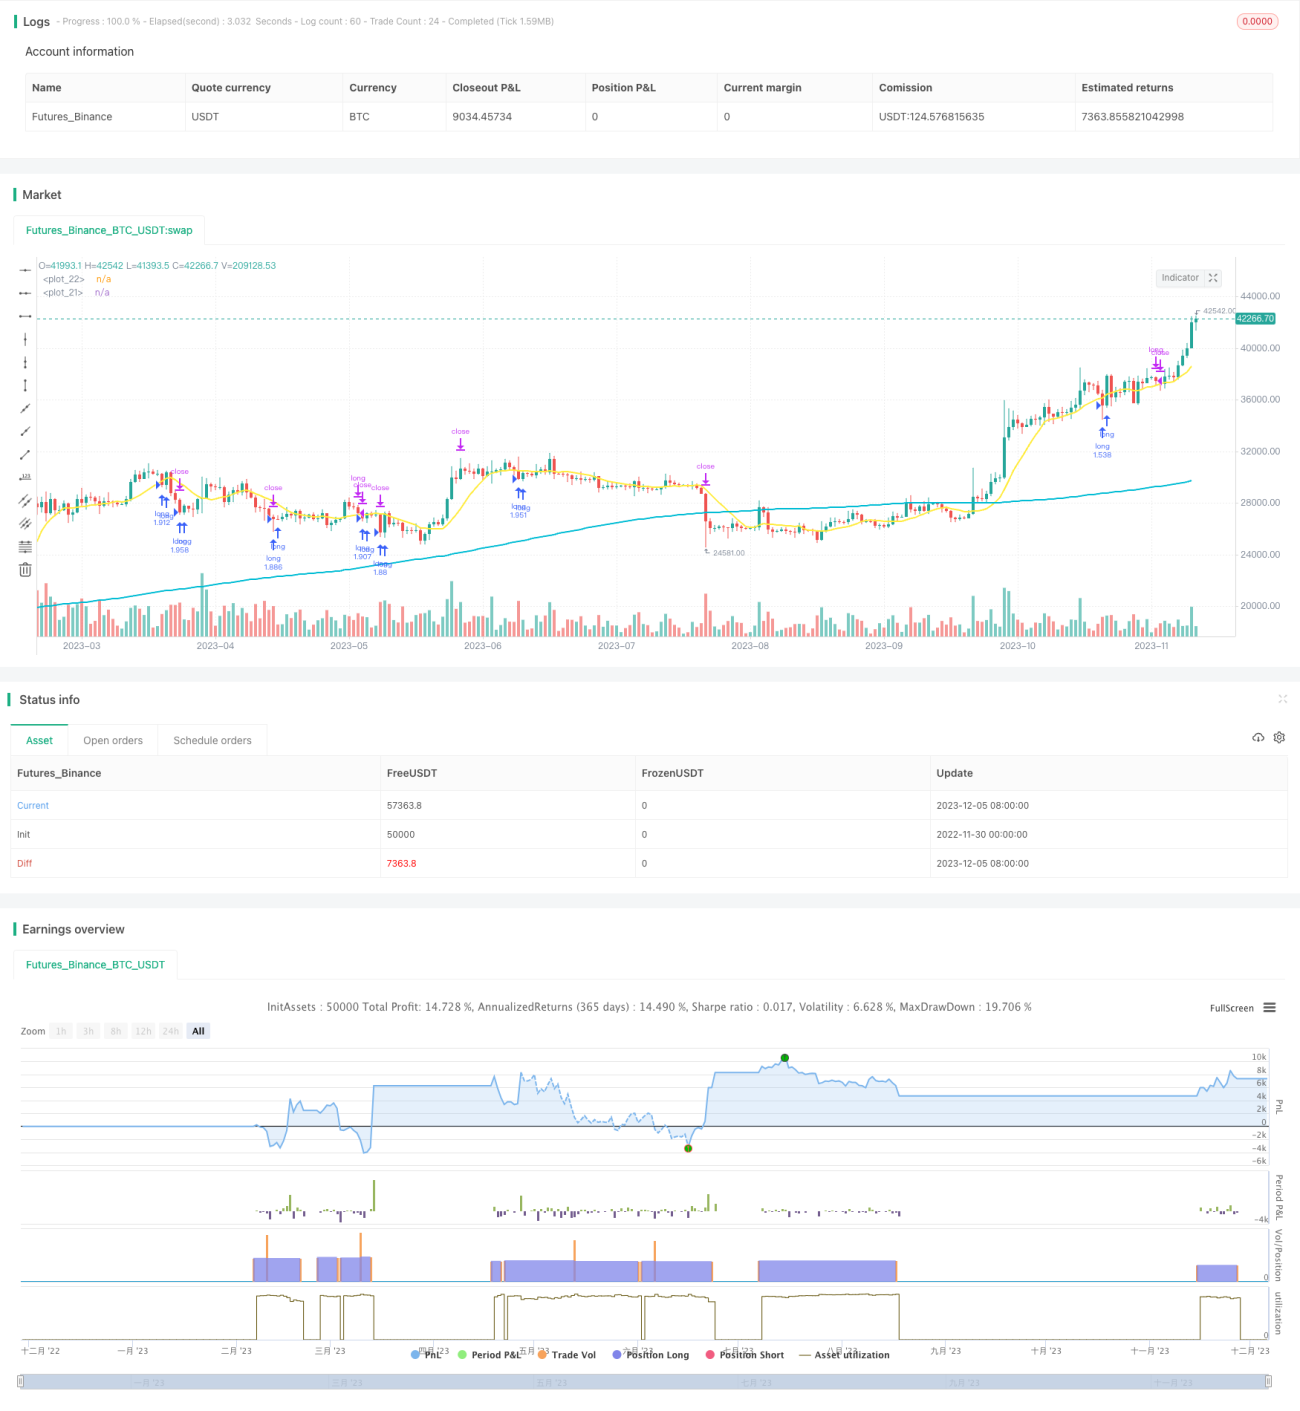
The moving average pullback trading strategy is a trend-following strategy. It utilizes the relationship between long-term and short-term moving averages to determine the overall trend direction and makes long entries during short-term pullbacks when prices are relatively low.
Strategy Logic
The key decision rules of this strategy are:
- When the closing price is above the long-term moving average, it confirms an upward trend that meets the opening position criteria
- When the closing price pulls back from above the short-term moving average to below the short-term moving average, there is a short-term pullback
- At this time, if the RSI indicator is less than 30, it is considered oversold and a buy signal is generated
- Establish a long position with the stop loss set below 5% of the entry price and take profit set above 10% of the entry price
With such combined criteria, we can establish positions during short-term pullbacks while the trend direction matches expectations.
Advantages of the Strategy
The biggest advantage of this strategy is that it only carries out long trades in an expected upward trend, which can effectively avoid the risk of a volatile market. At the same time, it chases the buy on the pullback of the short-term moving average, which allows entering the market at a relatively better price.
In addition, the strategy has set up mechanisms for stop loss and take profit. This allows us to control losses through stop loss even if the judgment is wrong and the market moves in the opposite direction; for profits, take profit allows locking in some gains.
Risks of the Strategy
Although this strategy considers the major trend judgment and sets up stop loss and take profit, there are still certain risks:
-
Risk of incorrect judgment of the major trend. When judging that the market has entered a bull market after opening long positions, the actual market has turned from bullish to sideways or bearish, which will cause huge losses.
-
The risk of stop loss being penetrated. Especially when major negative events occur, the market may gap down beyond the predetermined stop loss line, resulting in uncontrollable losses.
Accordingly, we can consider the following methods to mitigate risks:
-
Make good analyses of the general market to avoid misjudging the trend in the shock zone. Or set longer cycle moving averages to confirm the major trend.
-
Adopt conditional orders which get triggered on gap-down moves instead of simple stop loss orders. This can prevent stop loss orders from being penetrated to some extent.
Strategy Optimization
Considering the characteristics of this strategy with long-term judgment and short-term entry, we can further optimize it in the following aspects:
-
Optimize the cycle parameters of moving averages to find the best parameter combination
-
Increase other technical indicator filters. Such as adding volume analysis, or combining other overbought-oversold indicators on the basis of RSI
-
Dynamically adjust the stop loss and take profit range. We can make adaptive adjustments based on market volatility, appropriately widening the stop loss range during high volatility periods
-
Test adaptiveness across different products. This type of strategy may be more suitable for index products. Additional filters are needed when applied to individual stocks.
Conclusion
In general, the moving average pullback trading strategy is a relatively mature and steady strategy idea. It mainly considers the major trend and chances for short-term pullbacks, obtaining good entry opportunities without chasing new highs. At the same time, it locks in profits and controls risks through stop loss and take profit settings. This strategy is especially suitable for investors with strong comprehensive analytical capabilities and rich trading experience.
- 1