Bollinger + RSI Double Strategy (Long Only) v1.2

I. Strategy Name
Bollinger Bands + RSI Double Long Strategy
II. Strategy Overview
This strategy combines the Bollinger Bands indicator and the RSI indicator to go long when both show an oversold signal, and to close the long position when both show an overbought signal. Compared with a single indicator, it can more reliably confirm trading signals and avoid false signals.
III. Strategy Principle
- Use RSI indicator to judge overbought/oversold
- RSI below 50 is considered oversold
- RSI above 50 is considered overbought
- Use Bollinger Bands to judge price extremes
- Price below lower band is oversold
- Price above upper band is overbought
- Go long when both RSI and Bollinger Bands show oversold signal
- RSI below 50
- Price below Bollinger lower band
- Close long position when both RSI and Bollinger Bands show overbought signal
- RSI above 50
- Price above Bollinger upper band
IV. Strategy Strengths
- Combining two indicators makes signals more reliable and avoids false signals
- Only long positions simplify logic and reduce trading risk
V. Strategy Risks and Solutions
- Improper Bollinger Bands parameter setting, too wide upper/lower bands increase false trading risk
- Optimize Bollinger Bands parameters, set reasonable period and standard deviation
- Improper RSI parameter setting, wrong overbought/oversold standards increase false trading risk
- Optimize RSI parameters, adjust RSI period, set reasonable overbought/oversold standards
- Poor profitability when market lacks a trend
- Combine with trend indicators to avoid choppy markets
VI. Strategy Optimization Directions
- Optimize Bollinger Bands and RSI parameter settings
- Add stop loss mechanism
- Combine with trend indicators like MACD
- Add combination of short-term and long-term analysis
VII. Summary
This strategy combines the strengths of Bollinger Bands and RSI indicators to trade when both show extremes. This avoids false signals from a single indicator and improves signal accuracy. Compared to previous versions, only establishing long positions reduces trading risk. Future optimizations can be done through parameter tuning, stop loss mechanisms, combining with trend indicators etc. to make the strategy adaptable to different market environments.
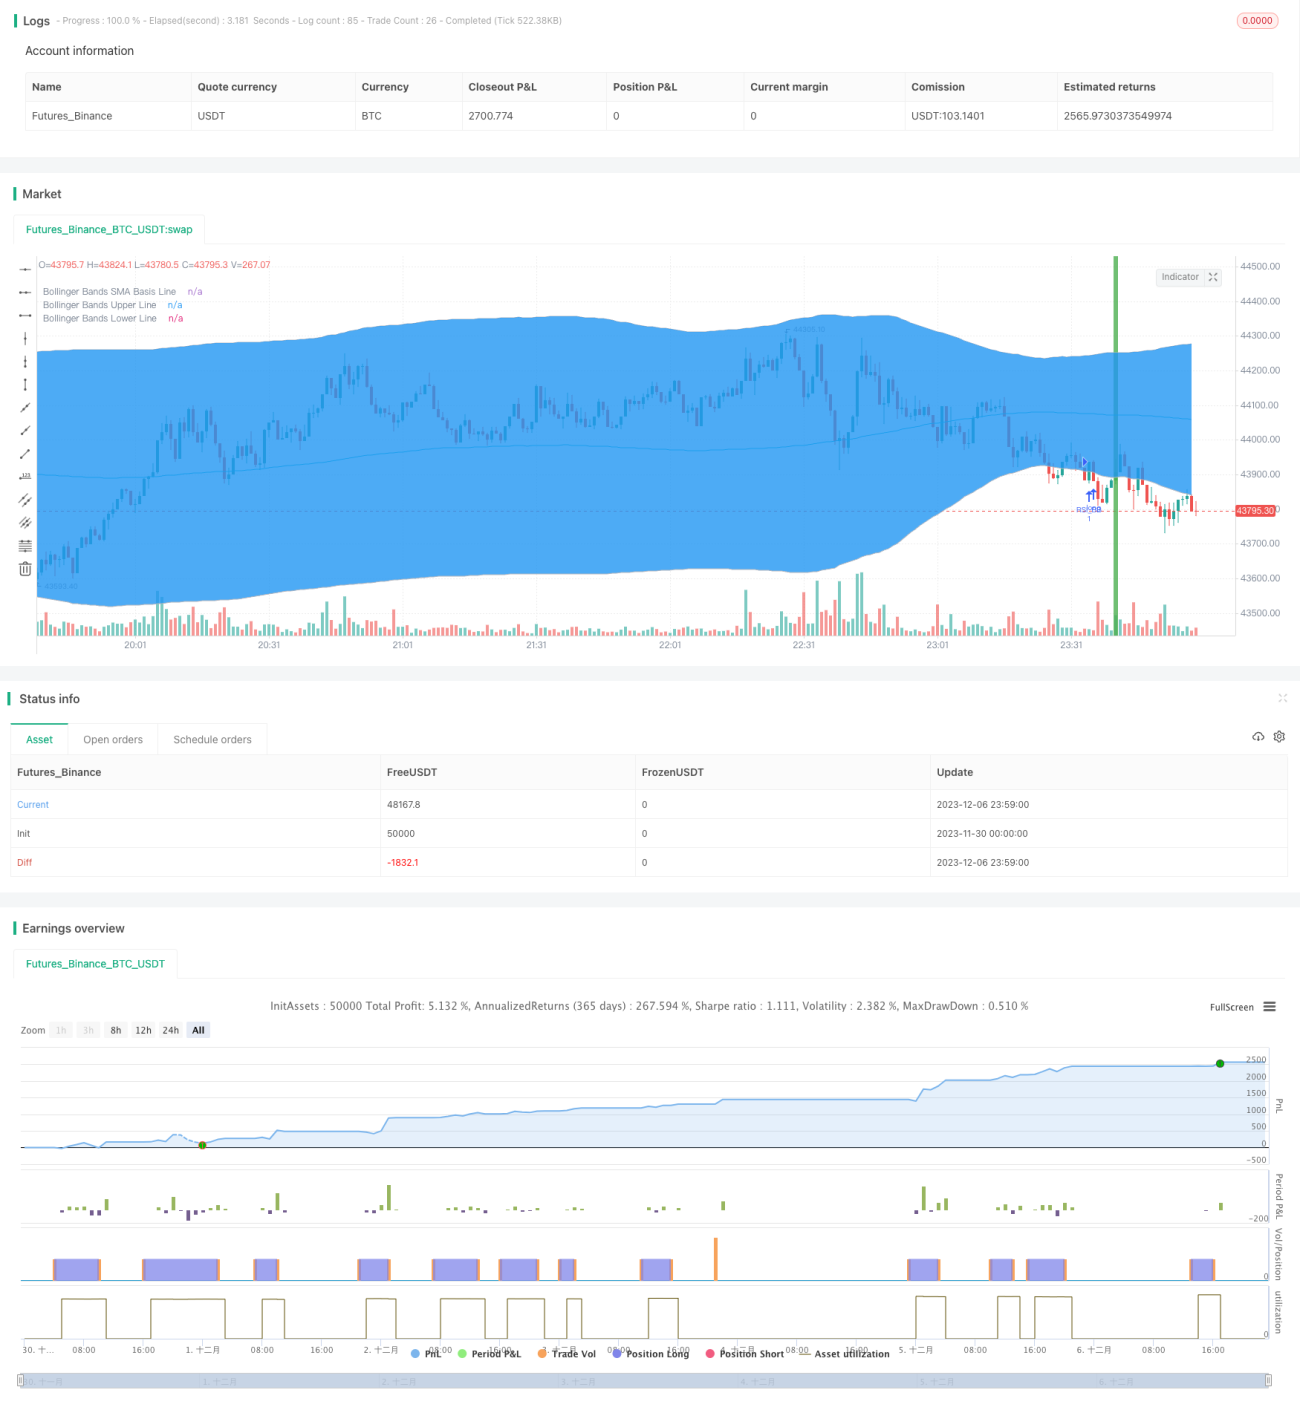
/*backtest
start: 2023-11-30 00:00:00
end: 2023-12-07 00:00:00
period: 1m
basePeriod: 1m
exchanges: [{"eid":"Futures_Binance","currency":"BTC_USDT"}]
*/

//@version=3
strategy("Bollinger + RSI, Double Strategy Long-Only (by ChartArt) v1.2", shorttitle="CA_-_RSI_Bol_Strat_1.2", overlay=true)

// ChartArt's RSI + Bollinger Bands, Double Strategy UPDATE: Long-Only- 1