概述
该策略是一种针对加密货币的智能量化低点反转交易策略。它利用多时间框架技术和自适应RSI指标判断市场可能的短期低点,在低点附近进行反转进入,获得超额收益。
策略原理
首先,该策略利用变化量和成交量计算自适应RSI指标,判断可能的市场短期低点。然后结合多时间框架技术在更大级别确定低点信号。当自适应RSI指标线从0水平下方上穿时产生买入信号。
具体来说,自适应RSI指标的计算方法是:先计算每根K线的变化量,再计算该根K线的成交量,然后变化量乘以成交量得到该根K线的量化力度。对量化力度进行RSI计算,并取N周期平均值,从而得到自适应RSI指标。该指标能清晰判断市场低点。
在此基础上,本策略又引入了多时间框架技术,在更高级别框架判断信号,避免被短期市场噪音干扰。当高级别均线从低点折返时,判断为本策略的买入时机。
优势分析
该策略最大的优势在于利用自适应RSI指标准确判断市场的短期低点,这为低点反转交易提供了有效信号。此外,多时间框架技术的加入也提高了信号的质量,避免被短期市场噪音干扰。
相比传统的RSI指标,自适应RSI指标加入了量化力度的计算,使得它对快速变化的加密货币市场更为敏感,可以更早、更准确地判断市场低点,这为低点反转交易提供了先机。
此外,该策略兼具趋势跟踪和反转交易的优点。在趋势不明朗的市场中,它可以利用反转交易获利。而在明确的牛市中,它也能跟踪趋势运行。
风险分析
该策略的主要风险在于低点判断的准确性无法100%保证。市场短期内常有巨大的非理性波动。如果低点继续下探,将面临较大的止损风险。
此外,多时间框架之间也可能出现背离。如果高时间框架信号出现滞后,则可能导致交易亏损。
为控制风险,该策略采用比较保守的止损机制,并设置分批止盈,逐步优化收益。此外也可适当调整自适应RSI的参数,优化低点判断的准确性。
优化方向
该策略可以从以下几个方面进行优化:
优化自适应RSI指标的参数,提高对市场低点的判断准确性。可以尝试不同的周期参数。
添加其他指标进行confirmation,避免出现错误信号。比如结合成交量指标等。
优化止损机制,在保证盈亏比的前提下,适当放宽止损幅度,赚取更多趋势利润。
优化时间框架的选择,在更大级别确保信号的可靠性。可以测试每日、每周等更高级别均线。
测试该策略在不同加密货币品种的效果,选择最佳品种。
总结
该智能量化低点反转策略通过自适应RSI指标和多时间框架技术判断市场可能的短期低点。它反转交易的特点使其能在不确定的行情中获得超额收益。同时,它也可跟踪明确趋势行情。通过持续优化,该策略有望获取更加可靠的交易信号,从而获得长期稳定收益。
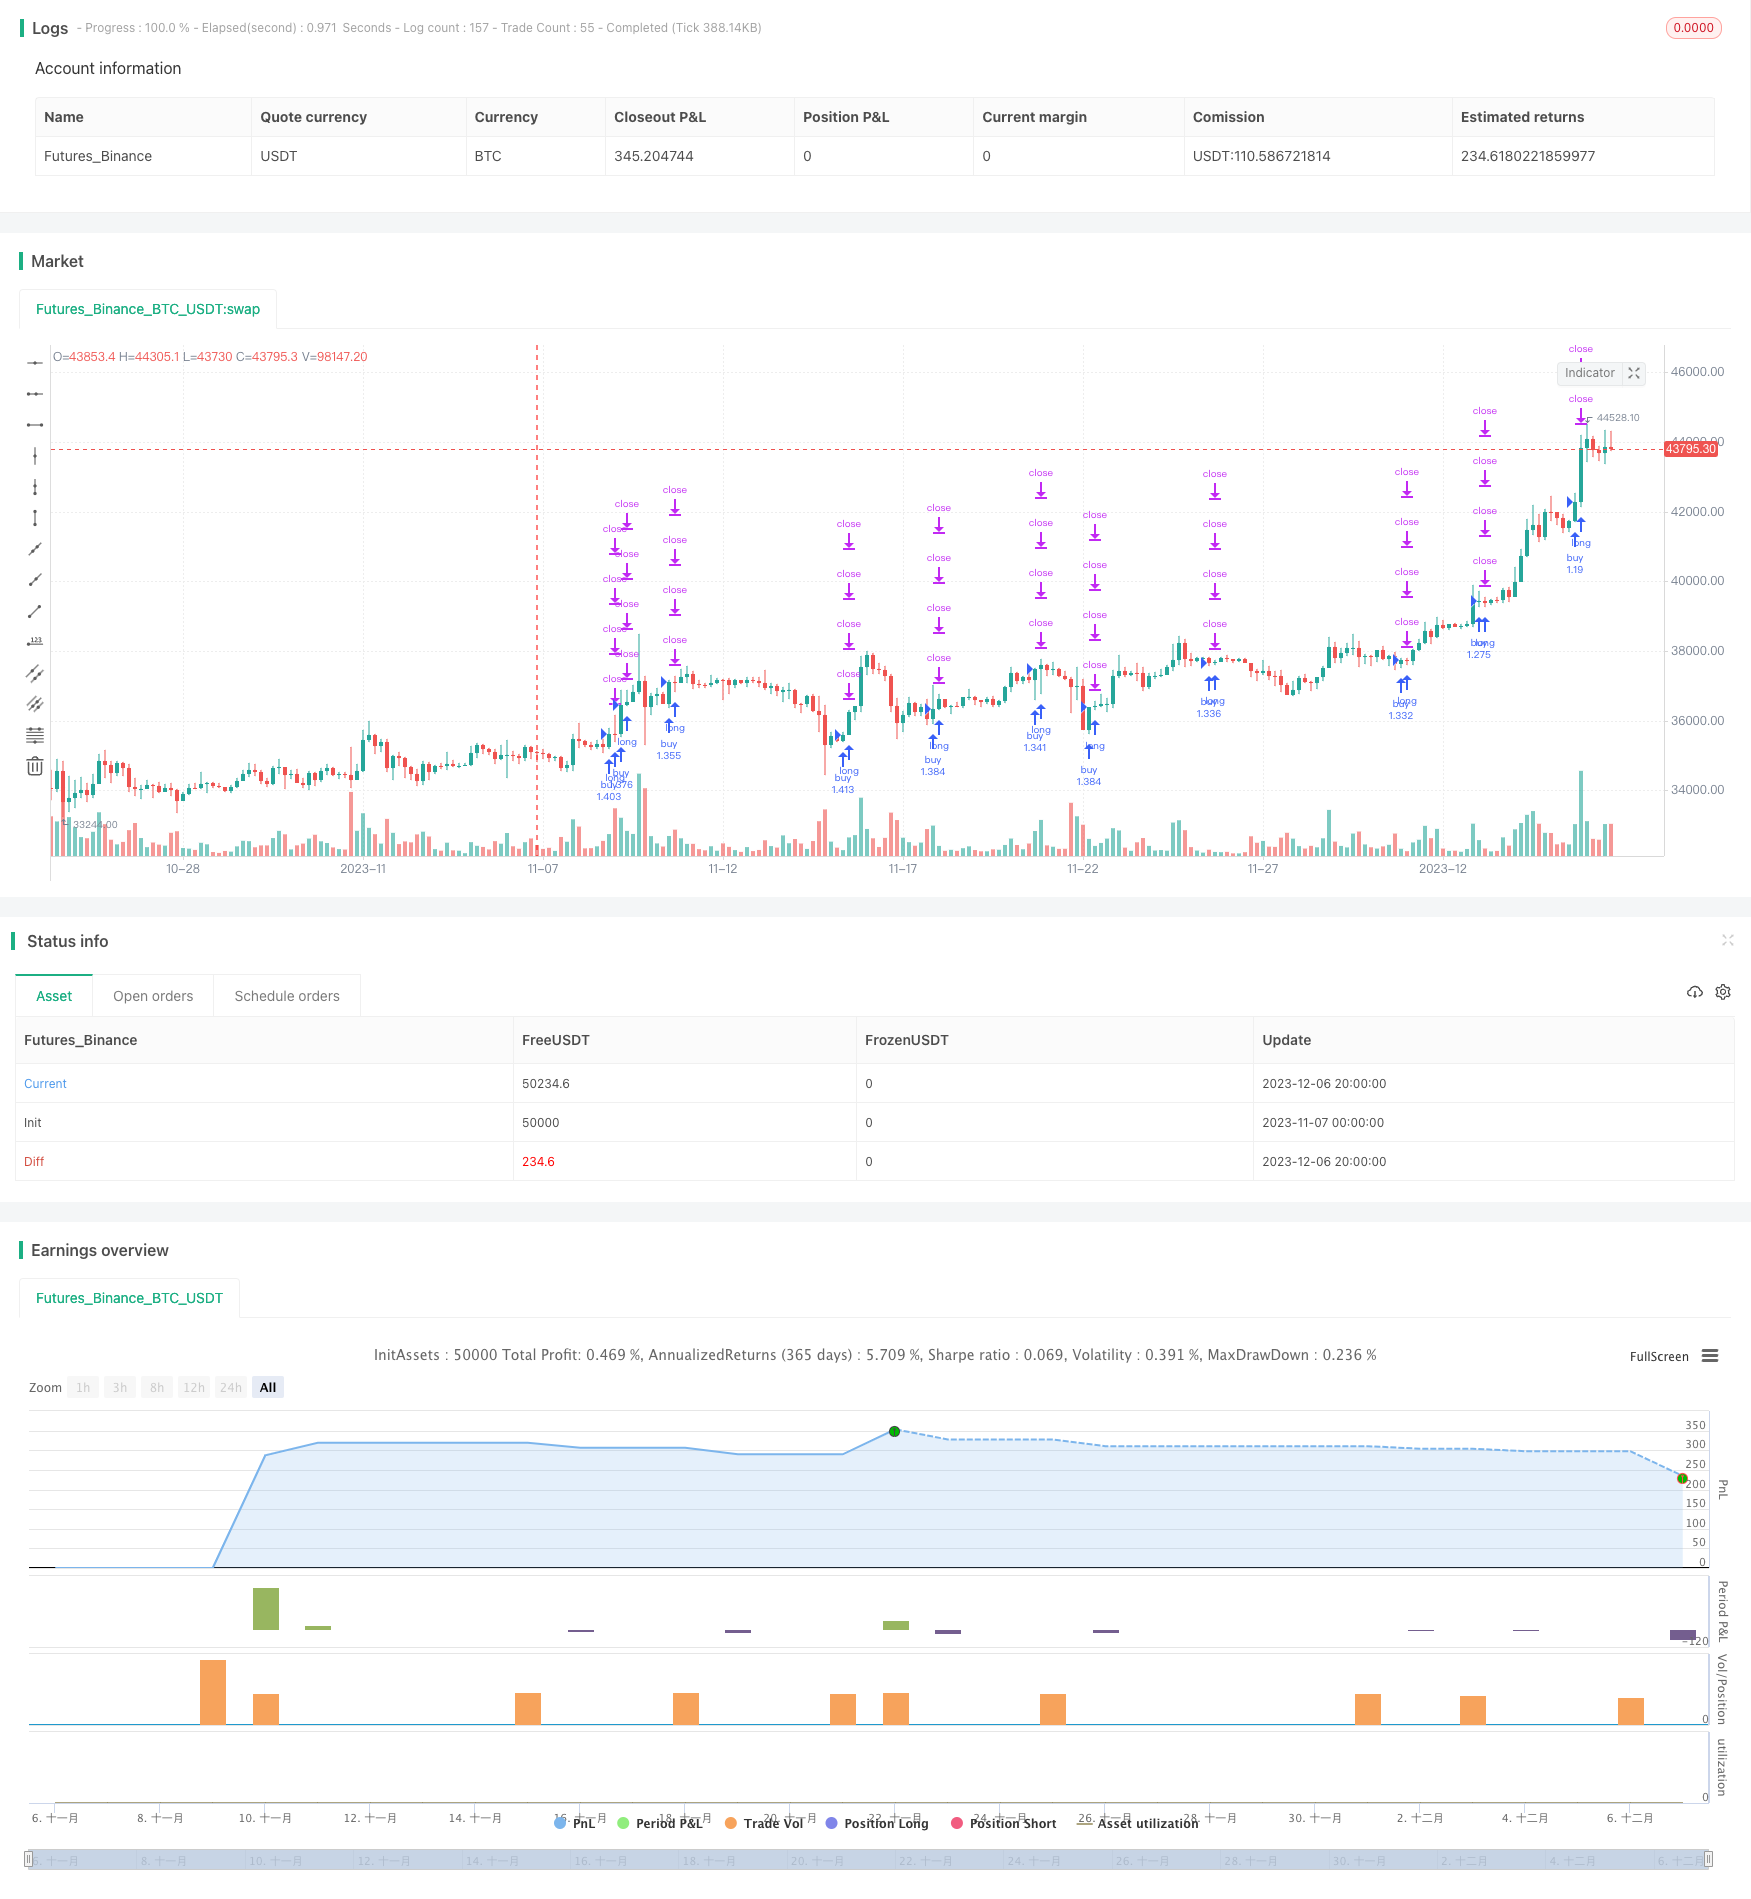
/*backtest
start: 2023-11-07 00:00:00
end: 2023-12-07 00:00:00
period: 4h
basePeriod: 15m
exchanges: [{"eid":"Futures_Binance","currency":"BTC_USDT"}]
*/

// © theCrypster 2020

//@version=4
strategy(title = "Low Scanner strategy crypto", overlay = false, pyramiding=1,initial_capital = 1000, default_qty_type= strategy.percent_of_equity, default_qty_value = 100, calc_on_order_fills=false, slippage=0,commission_type=strategy.commission.percent,commission_value=0.075)
strat_dir_input = input(title="Strategy Direction", defval="long", options=["long", "short", "all"])
strat_dir_value = strat_dir_input == "long" ? strategy.direction.long : strat_dir_input == "short" ? strategy.direction.short : strategy.direction.all
strategy.risk.allow_entry_in(strat_dir_value)
leng=1
p1=close[1]
min=input(10)
len55 = timeframe.isintraday and timeframe.multiplier >= 1 ?
   min / timeframe.multiplier * 7 :
   timeframe.isintraday and timeframe.multiplier < 60 ?
   60 / timeframe.multiplier * 24 * 7 : 7
//taken from https://www.tradingview.com/script/Ql1FjjfX-security-free-MTF-example-JD/
tf3 = input("60", type=input.resolution)
ti = change( time(tf3) ) != 0
T_c = fixnan( ti ? close : na )

vrsi = rsi(cum(change(T_c) * volume), leng)
pp=wma(vrsi,len55)

d=(vrsi[1]-pp[1])
min1 =input(1)
len100 = timeframe.isintraday and timeframe.multiplier >= 1 ?
   min1 / timeframe.multiplier * 7 :
   timeframe.isintraday and timeframe.multiplier < 60 ?
   60 / timeframe.multiplier * 24 * 7 : 7
x=ema(d,len100)
//
zx=x/-1
col=zx > 0? color.lime : color.orange
plot(zx,color=col,linewidth=1)
//

tf10 = input("60", title = "Timeframe", type = input.resolution, options = ["1", "5", "15", "30", "60","120", "240","360","720", "D", "W"])

length = input(24, title = "Period", type = input.integer)
shift = input(1, title = "Shift", type = input.integer)

hma(_src, _length)=>
    wma((2 * wma(_src, _length / 2)) - wma(_src, _length), round(sqrt(_length)))

hma3(_src, _length)=>
    p = length/2
    wma(wma(close,p/3)*3 - wma(close,p/2) - wma(close,p),p)


a = security(syminfo.tickerid, tf10, hma(close, length))
b =security(syminfo.tickerid, tf10, hma3(close[1], length)[shift])
//plot(a,color=color.gray)
//plot(b,color=color.yellow)
close_price = close[0]
len = input(25)

linear_reg = linreg(close_price, len, 0)


//plot(linear_reg, color=color.blue, title="LR", linewidth=3)

buy=crossover(linear_reg, b)
sell=crossunder(linear_reg, b)
//
l = crossover(zx,0) or buy

if l
    strategy.entry("buy", strategy.long)

per(pcnt) =>
    strategy.position_size != 0 ? round(pcnt / 100 * strategy.position_avg_price / syminfo.mintick) : float(na)
stoploss=input(title=" stop loss", defval=10, minval=0.01)
los = per(stoploss)
q1=input(title=" qty_percent1", defval=25, minval=1)
q2=input(title=" qty_percent2", defval=25, minval=1)
q3=input(title=" qty_percent3", defval=25, minval=1)
tp1=input(title=" Take profit1", defval=1, minval=0.01)
tp2=input(title=" Take profit2", defval=2, minval=0.01)
tp3=input(title=" Take profit3", defval=3, minval=0.01)
tp4=input(title=" Take profit4", defval=5, minval=0.01)
strategy.exit("x1", qty_percent = q1, profit = per(tp1), loss = los)
strategy.exit("x2", qty_percent = q2, profit = per(tp2), loss = los)
strategy.exit("x3", qty_percent = q3, profit = per(tp3), loss = los)
strategy.exit("x4", profit = per(tp4), loss = los)