N Consecutive Higher Closes Breakout Strategy

Overview
The core logic of this strategy is to detect whether the closing price of N consecutive candles keeps rising. If so, go long; otherwise, close position. This can capture the uptrend of stock price and make profit.
Strategy Principle
The core indicator of this strategy is nCounter. It compares the closing price and opening price of current candle to judge whether the price rises.
Specifically, if close[1]>=open[1], nCounter adds 1, indicating rise; if close[1]<open[1], nCounter resets to 0. Thus it can count the number of consecutive rising candles.
Then compare nCounter with parameter nLength. When nCounter>=nLength, output signal C1=1; otherwise C1=0. Here nLength is the number of consecutive rising candles we defined to generate signal.
After receiving C1=1 signal, if there is no current position, go long; if already in long position, keep holding.
In addition, this strategy sets stop loss and take profit conditions. If price falls below entry price by certain percentage, stop loss exits position; if rises above entry price by certain percentage, take profit.
Advantage Analysis
This is a typical trend following strategy with below strengths:
- It can seize the uptrend opportunities of stock price, suitable as long strategy
- N consecutive rises as entry signal can effectively filter false breakout and reduce unnecessary trades
- Setting stop loss and take profit can limit downside risk and lock in profits
- The logic is simple and clear, easy to understand and modify
- Trading frequency can be controlled by adjusting nLength parameter
Risk Analysis
There are some risks of this strategy, mainly in below aspects:
- If uptrend reverses, failure to stop loss in time may lead to huge loss
- If nLength set too large, good entry opportunities may be missed
- It does not consider market environment. Holding long position when market crashes can lead to extra loss
- Using unified parameters without adjusting based on different stock characteristics may not apply to some stocks
To reduce these risks, we can set more strict stop loss, optimize nLength, add market condition rules, or test parameters separately for different stocks. Of course no strategy can completely avoid losses. It needs to match risk appetite of traders.
Optimization Directions
Considering above risks, we can optimize the strategy from below aspects:
- Add moving stop loss or trailing stop loss functions. They can adjust stop loss point accordingly based on price change to reduce loss risk
- Optimize nLength parameter. Respectively test for different types of stocks to find out more suitable parameter values
- Add market environment judgement. For example pause trading when market crashes to avoid extra losses in bear market
- Add other factors like volume as auxiliary conditions. For example require enlarged volume during uptrend to ensure breakout validity
- Set drawdown control like max allowed loss percentage, max consecutive loss times etc. to stop loss automatically controlling overall loss
Conclusion
This strategy captures uptrend by detecting N consecutive rising candles. It can effectively conduct trend following. The advantages are simple logic, flexible parameter tuning, filtering false breakout. But there are also some risks. It needs to add modules like stop loss, parameter optimization, environment judgement to improve. Overall speaking, this strategy provides a valuable basic model for quantitative trading. It can become a powerful trading tool after continuous improvement.
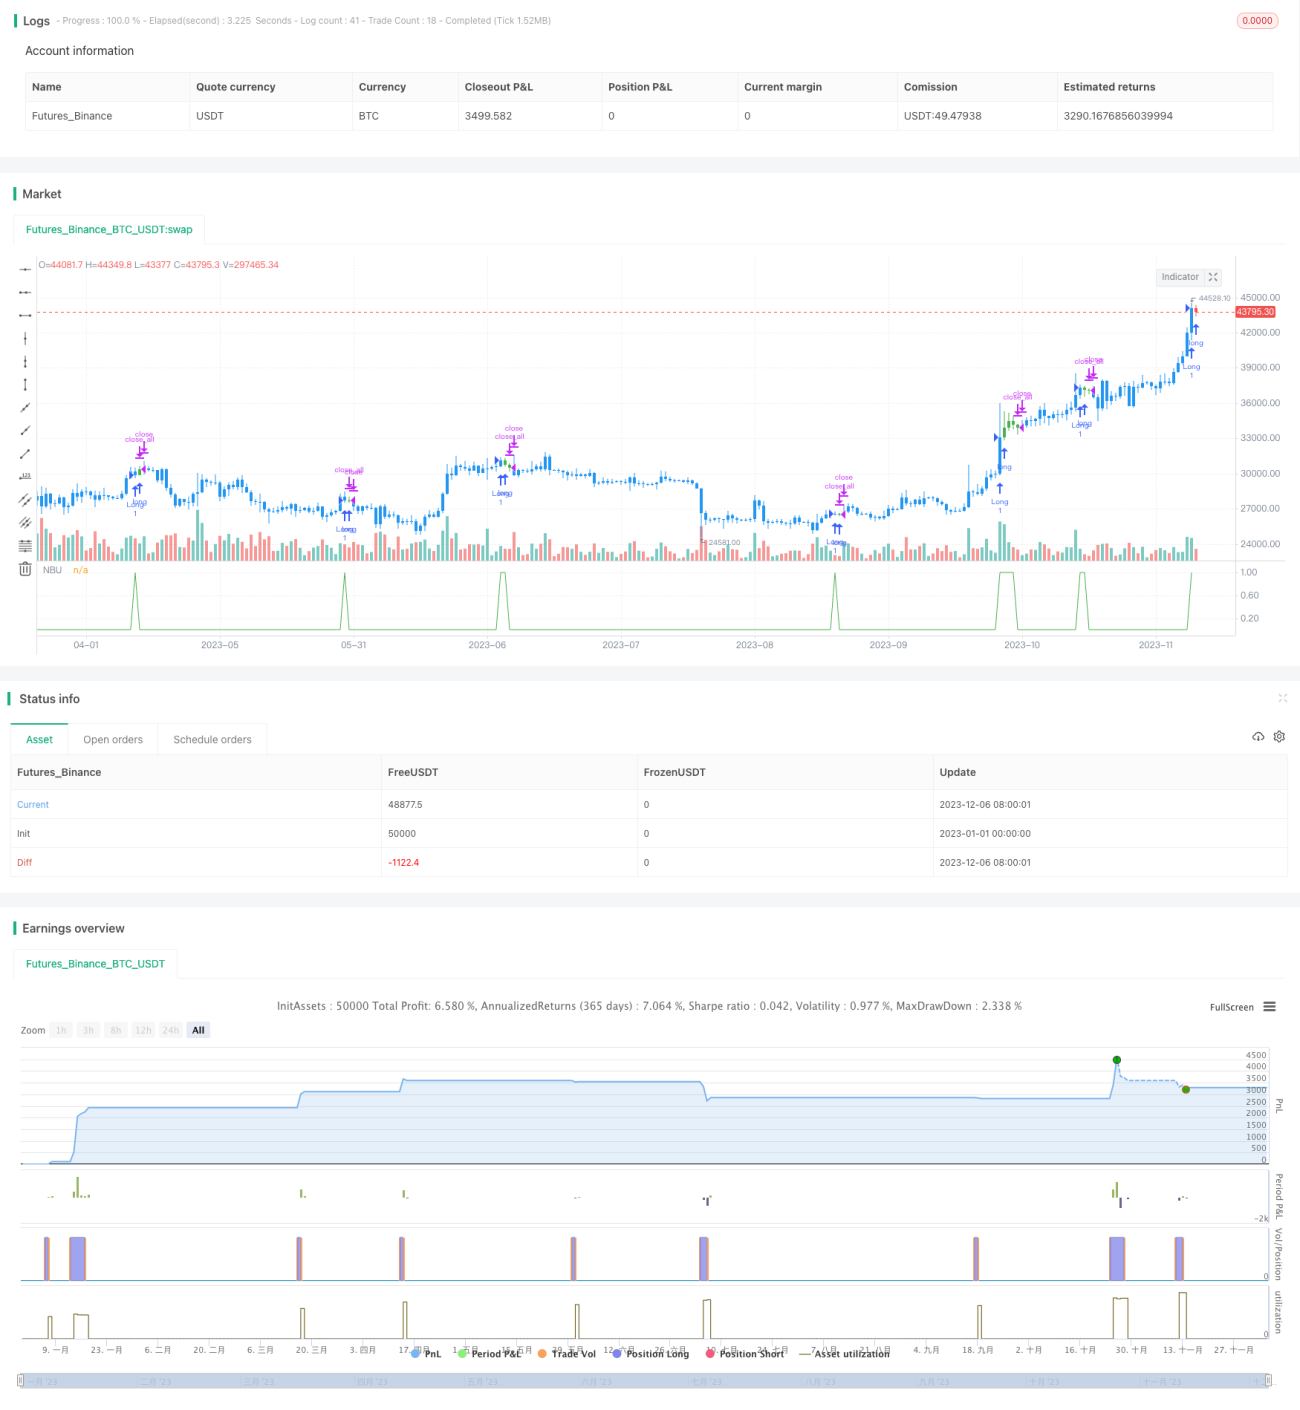
/*backtest
start: 2023-01-01 00:00:00
end: 2023-12-07 00:00:00
period: 1d
basePeriod: 1h
exchanges: [{"eid":"Futures_Binance","currency":"BTC_USDT"}]
*/

//@version=4
////////////////////////////////////////////////////////////
//  Copyright by HPotter v1.0 05/02/2020
// Evaluates for n number of consecutive higher closes. Returns a value - 1