kNN-based Trend Following Strategy

Author: ChaoZhang, Date: 2023-12-08 11:33:31
Tags:

img

Overview

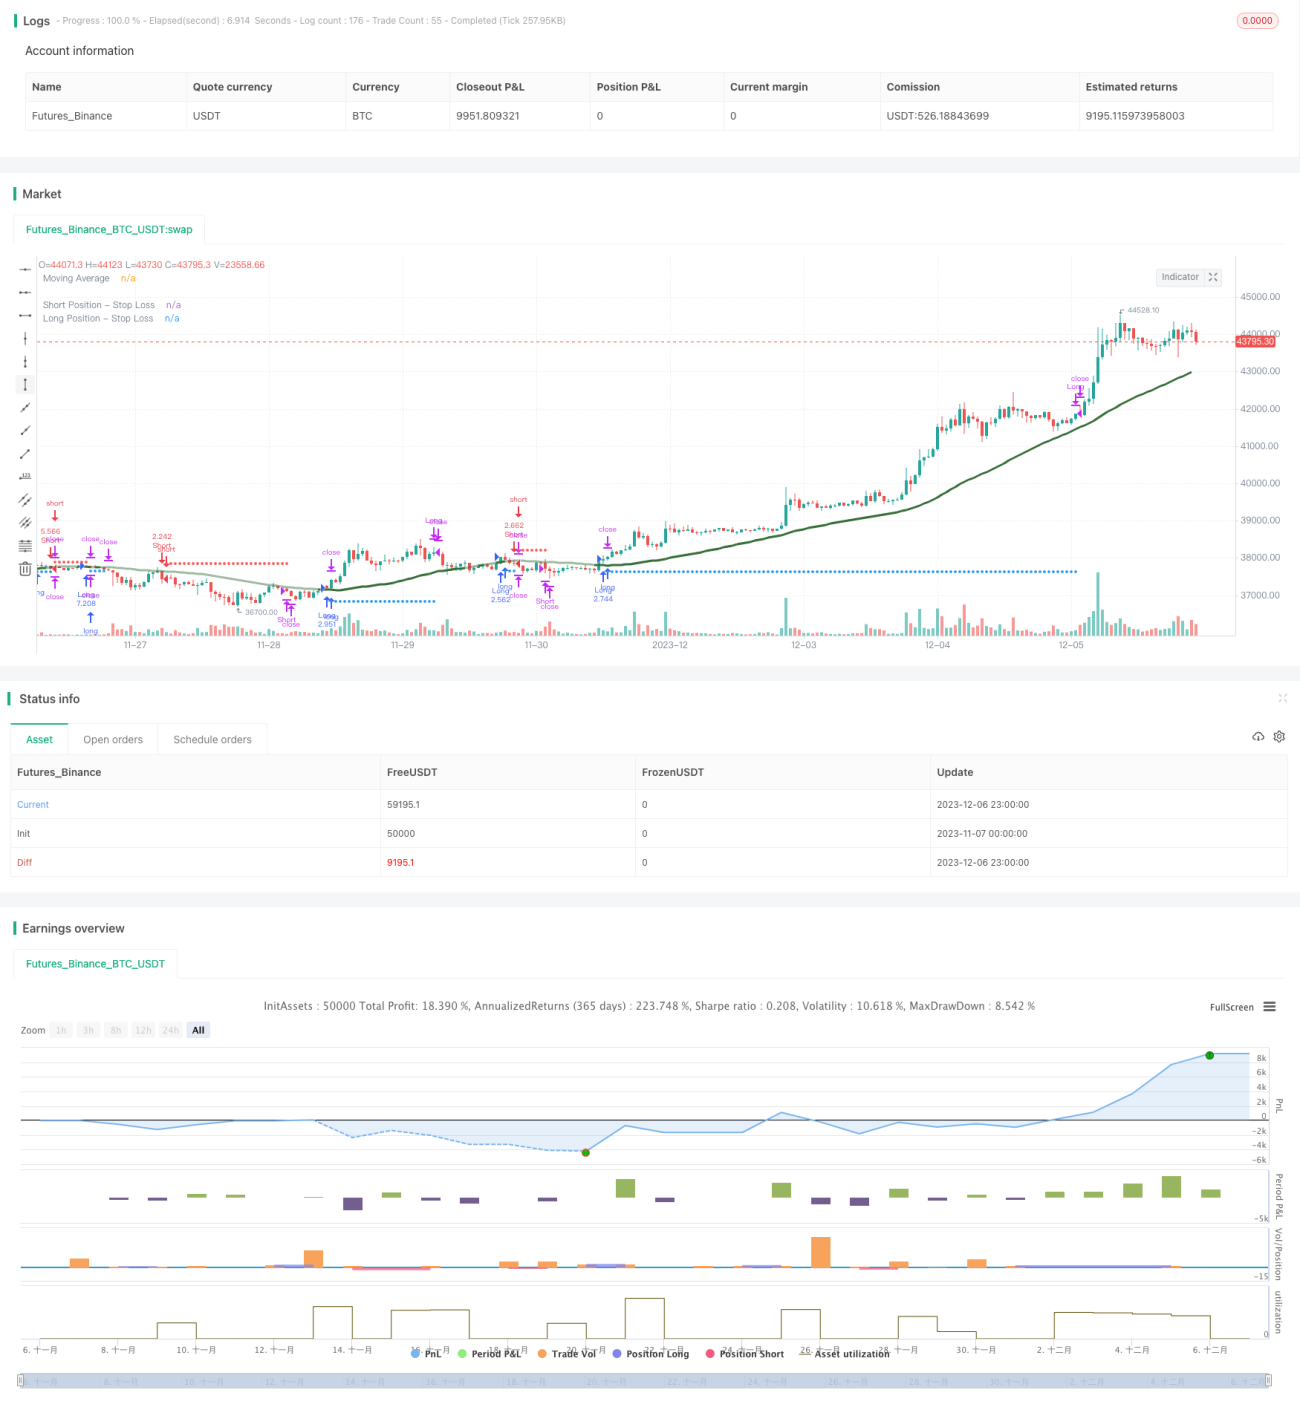
This strategy utilizes the kNN (k Nearest Neighbors) machine learning algorithm to predict market trends and generate long and short signals accordingly. It comprehensively considers multiple factors like historical data, technical indicators, and so on, dynamically capturing market patterns through training kNN models to realize automated trend following trading.

Strategy Principle

  1. Collect training data: collect historical data like closing prices, trading volumes, as well as technical indicators like RSI, CCI over time.

  2. Data preprocessing: normalize indicator values into range 0-100.

  3. Train kNN model: take current two features in the kNN model, calculate Euclidean distances between these feature vectors and historical ones, choose k nearest neighbor samples based on distances, and count label (bullish or bearish) distribution of these k samples.

  4. Obtain predictions: make predictions on current market trend based on labels of k nearest neighbors. If prediction is bullish, generate long signal. If prediction is bearish, generate short signal.

  5. Trade using stop loss, position sizing, moving average filters.

Advantages

  1. Automatically recognize technical patterns using machine learning without manual intervention.

  2. Flexibility to select different technical indicators as model features for real-time optimization.

  3. Integrates strict risk control mechanisms like stop loss, position sizing.

  4. Visualized stop loss lines for clarity and intuition.

Risks and Solutions

  1. Prediction errors may exist in machine learning. Optimization methods include adjusting k value, feature vectors, sample time range properly.

  2. Potential risks in one-direction trading. Add permission for two-way trading in code to eliminate bugs.

  3. Improper parameter settings may lead to overtrading. Adjust position sizing, trading frequency accordingly.

Optimization Directions

  1. Test different types of technical indicators as kNN input features.

  2. Try other distance metrics like Manhattan distance.

  3. Use sample distances or classification quality to adjust position sizes.

  4. Add model train/test split for rolling optimization.

Conclusion

This strategy realizes market trend prediction using classical kNN algorithm and executes trend following trading based on prediction signals. It features adjustable parameters and controllable risks, providing effective automated trading solutions for users. Users can continuously improve strategy performance by optimizing technical indicator combinations, model hyperparameters and more.


/*backtest
start: 2023-11-07 00:00:00
end: 2023-12-07 00:00:00
period: 1h
basePeriod: 15m
exchanges: [{"eid":"Futures_Binance","currency":"BTC_USDT"}]
*/

// This source code is subject to the terms of the Mozilla Public License 2.0 at https://mozilla.org/MPL/2.0/
// © sosacur01

//@version=5
strategy(title=" kNN-based| Trend Following  | Trend Following", overlay=true, pyramiding=1, commission_type=strategy.commission.percent, commission_value=0.2, initial_capital=10000)

//==========================================
// This script, based on Capissimo's original indicator code, transforms a kNN-based machine learning indicator into a TradingView strategy.
// It incorporates a backtest date range filter, on/off controls for long and short positions, a moving average filter, and dynamic risk management for adaptive position sizing.
// Credit to Capissimo for the foundational kNN algorithm.
//==========================================

//BACKTEST RANGE
useDateFilter = input.bool(true, title="Filter Date Range of Backtest",
     group="Backtest Time Period")
backtestStartDate = input(timestamp("1 jan 2017"), 
     title="Start Date", group="Backtest Time Period",
     tooltip="This start date is in the time zone of the exchange " + 
     "where the chart's instrument trades. It doesn't use the time " + 
     "zone of the chart or of your computer.")
backtestEndDate = input(timestamp("1 Jul 2100"),
     title="End Date", group="Backtest Time Period",
     tooltip="This end date is in the time zone of the exchange " + 
     "where the chart's instrument trades. It doesn't use the time " + 
     "zone of the chart or of your computer.")
inTradeWindow = true
if not inTradeWindow and inTradeWindow[1]
    strategy.cancel_all()
    strategy.close_all(comment="Date Range Exit")

//--------------------------------------

//LONG/SHORT POSITION ON/OFF INPUT
LongPositions   = input.bool(title='On/Off Long Postion', defval=true, group="Long & Short Position")
ShortPositions  = input.bool(title='On/Off Short Postion', defval=true, group="Long & Short Position")

//--------------------------------------
// kNN-based Strategy (FX and Crypto)
// Description: 
// This strategy uses a classic machine learning algorithm - k Nearest Neighbours (kNN) - 
// to let you find a prediction for the next (tomorrow's, next month's, etc.) market move. 
// Being an unsupervised machine learning algorithm, kNN is one of the most simple learning algorithms. 

// To do a prediction of the next market move, the kNN algorithm uses the historic data, 
// collected in 3 arrays - feature1, feature2 and directions, - and finds the k-nearest 
// neighbours of the current indicator(s) values. 

// The two dimensional kNN algorithm just has a look on what has happened in the past when 
// the two indicators had a similar level. It then looks at the k nearest neighbours, 
// sees their state and thus classifies the current point.

// The kNN algorithm offers a framework to test all kinds of indicators easily to see if they 
// have got any *predictive value*. One can easily add cog, wpr and others.
// Note: TradingViews's playback feature helps to see this strategy in action.
// Warning: Signals ARE repainting.

// Style tags: Trend Following, Trend Analysis
// Asset class: Equities, Futures, ETFs, Currencies and Commodities
// Dataset: FX Minutes/Hours+++/Days

//-- Preset Dates

int startdate = timestamp('01 Jan 2000 00:00:00 GMT+10')
int stopdate  = timestamp('31 Dec 2025 23:45:00 GMT+10')

//-- Inputs

StartDate  = input  (startdate, 'Start Date', group="kNN-based Inputs")
StopDate   = input  (stopdate,  'Stop Date', group="kNN-based Inputs")
Indicator  = input.string('RSI',     'Indicator',   ['RSI','ROC','CCI','Volume','All'], group="kNN-based Inputs")
ShortWinow = input.int   (8,        'Short Period [1..n]', 1, group="kNN-based Inputs")
LongWindow = input.int   (29,        'Long Period [2..n]',  2, group="kNN-based Inputs")
BaseK      = input.int   (400,       'Base No. of Neighbours (K) [5..n]', 5, group="kNN-based Inputs")
Filter     = input.bool  (false,     'Volatility Filter', group="kNN-based Inputs")
Bars       = input.int   (300,       'Bar Threshold [2..5000]', 2, 5000, group="kNN-based Inputs")

//-- Constants

var int BUY   = 1
var int SELL  =-1
var int CLEAR = 0

var int k     = math.floor(math.sqrt(BaseK))  // k Value for kNN algo

//-- Variable

// Training data, normalized to the range of [0,...,100]
var array<float> feature1   = array.new_float(0)  // [0,...,100]
var array<float> feature2   = array.new_float(0)  //    ...
var array<int>   directions = array.new_int(0)    // [-1; +1]

// Result data
var array<int>   predictions = array.new_int(0)
var float        prediction  = 0.0
var array<int>   bars        = array.new<int>(1, 0) // array used as a container for inter-bar variables

// Signals
var int          signal      = CLEAR

//-- Functions

minimax(float x, int p, float min, float max) => 
    float hi = ta.highest(x, p), float lo = ta.lowest(x, p)
    (max - min) * (x - lo)/(hi - lo) + min

cAqua(int g) => g>9?#0080FFff:g>8?#0080FFe5:g>7?#0080FFcc:g>6?#0080FFb2:g>5?#0080FF99:g>4?#0080FF7f:g>3?#0080FF66:g>2?#0080FF4c:g>1?#0080FF33:#00C0FF19
cPink(int g) => g>9?#FF0080ff:g>8?#FF0080e5:g>7?#FF0080cc:g>6?#FF0080b2:g>5?#FF008099:g>4?#FF00807f:g>3?#FF008066:g>2?#FF00804c:g>1?#FF008033:#FF008019

inside_window(float start, float stop) =>  
    time >= start and time <= stop ? true : false

//-- Logic

bool window = true

// 3 pairs of predictor indicators, long and short each
float rs = ta.rsi(close,   LongWindow),        float rf = ta.rsi(close,   ShortWinow)
float cs = ta.cci(close,   LongWindow),        float cf = ta.cci(close,   ShortWinow)
float os = ta.roc(close,   LongWindow),        float of = ta.roc(close,   ShortWinow)
float vs = minimax(volume, LongWindow, 0, 99), float vf = minimax(volume, ShortWinow, 0, 99)

// TOADD or TOTRYOUT:
//    ta.cmo(close, LongWindow), ta.cmo(close, ShortWinow)
//    ta.mfi(close, LongWindow), ta.mfi(close, ShortWinow)
//    ta.mom(close, LongWindow), ta.mom(close, ShortWinow)

float f1 = switch Indicator
    'RSI'    => rs 
    'CCI'    => cs 
    'ROC'    => os 
    'Volume' => vs 
    => math.avg(rs, cs, os, vs)

float f2 = switch Indicator
    'RSI'    => rf 
    'CCI'    => cf
    'ROC'    => of
    'Volume' => vf 
    => math.avg(rf, cf, of, vf)

// Classification data, what happens on the next bar
int class_label = int(math.sign(close[1] - close[0])) // eq. close[1]<close[0] ? SELL: close[1]>close[0] ? BUY : CLEAR

// Use particular training period
if window
    // Store everything in arrays. Features represent a square 100 x 100 matrix,
    // whose row-colum intersections represent class labels, showing historic directions
    array.push(feature1, f1)
    array.push(feature2, f2)
    array.push(directions, class_label)

// Ucomment the followng statement (if barstate.islast) and tab everything below
// between BOBlock and EOBlock marks to see just the recent several signals gradually 
// showing up, rather than all the preceding signals

//if barstate.islast   

//==BOBlock	

// Core logic of the algorithm
int   size    = array.size(directions)
float maxdist = -999.0
// Loop through the training arrays, getting distances and corresponding directions.
for i=0 to size-1
    // Calculate the euclidean distance of current point to all historic points,
    // here the metric used might as well be a manhattan distance or any other.
    float d = math.sqrt(math.pow(f1 - array.get(feature1, i), 2) + math.pow(f2 - array.get(feature2, i), 2))
    
    if d > maxdist
        maxdist := d
        if array.size(predictions) >= k
            array.shift(predictions)
        array.push(predictions, array.get(directions, i))
        
//==EOBlock	

// Note: in this setup there's no need for distances array (i.e. array.push(distances, d)),
//       but the drawback is that a sudden max value may shadow all the subsequent values.
// One of the ways to bypass this is to:
// 1) store d in distances array,
// 2) calculate newdirs = bubbleSort(distances, directions), and then 
// 3) take a slice with array.slice(newdirs) from the end
    	
// Get the overall prediction of k nearest neighbours
prediction := array.sum(predictions)   

bool filter = Filter ? ta.atr(10) > ta.atr(40) : true // filter out by volatility or ex. ta.atr(1) > ta.atr(10)...

// Now that we got a prediction for the next market move, we need to make use of this prediction and 
// trade it. The returns then will show if everything works as predicted.
// Over here is a simple long/short interpretation of the prediction, 
// but of course one could also use the quality of the prediction (+5 or +1) in some sort of way,
// ex. for position sizing.

bool long  = prediction > 0 and filter
bool short = prediction < 0 and filter
bool clear = not(long and short)

if array.get(bars, 0)==Bars    // stop by trade duration
    signal := CLEAR
    array.set(bars, 0, 0)
else
    array.set(bars, 0, array.get(bars, 0) + 1)

signal := long ? BUY : short ? SELL : clear ? CLEAR : nz(signal[1])

int  changed         = ta.change(signal)
bool startLongTrade  = changed and signal==BUY 
bool startShortTrade = changed and signal==SELL 
// bool endLongTrade    = changed and signal==SELL
// bool endShortTrade   = changed and signal==BUY  
bool clear_condition = changed and signal==CLEAR //or (changed and signal==SELL) or (changed and signal==BUY)

float maxpos = ta.highest(high, 10)
float minpos = ta.lowest (low,  10)


//----//MA INPUTS
MAFilter        = input.bool(title='Use MA as Filter', defval=true, group = "MA Inputs")
averageType1    = input.string(defval="SMA", group="MA Inputs", title="MA Type", options=["SMA", "EMA", "WMA", "HMA", "RMA", "SWMA", "ALMA", "VWMA", "VWAP"])
averageLength1  = input.int(defval=40, title="MA Length", group="MA Inputs")
averageSource1  = input(close, title="MA Source", group="MA Inputs")        

//MA TYPE
MovAvgType1(averageType1, averageSource1, averageLength1) =>
	switch str.upper(averageType1)
        "SMA"  => ta.sma(averageSource1, averageLength1)
        "EMA"  => ta.ema(averageSource1, averageLength1)
        "WMA"  => ta.wma(averageSource1, averageLength1)
        "HMA"  => ta.hma(averageSource1, averageLength1)
        "RMA"  => ta.rma(averageSource1, averageLength1)
        "SWMA" => ta.swma(averageSource1)
        "ALMA" => ta.alma(averageSource1, averageLength1, 0.85, 6)
        "VWMA" => ta.vwma(averageSource1, averageLength1)
        "VWAP" => ta.vwap(averageSource1)
        => runtime.error("Moving average type '" + averageType1 + 
             "' not found!"), na


// MA COLOR VALUES
ma = MovAvgType1(averageType1, averageSource1, averageLength1)
ma_plot = close > ma ? color.rgb(54, 111, 56) : color.rgb(54, 111, 56, 52)

// MA BUY/SELL CONDITIONS
bullish_ma = MAFilter ? close > ma  : inTradeWindow
bearish_ma = MAFilter ? close < ma  : inTradeWindow

// MA ALTERNATING PLOT
plot(MAFilter ? ma : na, color=ma_plot, title="Moving Average", linewidth=3)
//--------------------------------------

//ENTRIES AND EXITS
long_entry  = if inTradeWindow and startLongTrade and bullish_ma and LongPositions
    true
long_exit   = if inTradeWindow and startShortTrade
    true

short_entry = if inTradeWindow and startShortTrade and bearish_ma and ShortPositions
    true
short_exit  = if inTradeWindow and startLongTrade
    true
    
//--------------------------------------
//RISK MANAGEMENT - SL, MONEY AT RISK, POSITION SIZING
atrPeriod                = input.int(7, "ATR Length", group="Risk Management Inputs")
sl_atr_multiplier        = input.float(title="Long Position - Stop Loss - ATR Multiplier", defval=2, group="Risk Management Inputs", step=0.5)
sl_atr_multiplier_short  = input.float(title="Short Position - Stop Loss - ATR Multiplier", defval=2, group="Risk Management Inputs", step=0.5)
i_pctStop                = input.float(2, title="% of Equity at Risk", step=.5, group="Risk Management Inputs")/100

//ATR VALUE
_atr = ta.atr(atrPeriod)

//CALCULATE LAST ENTRY PRICE
lastEntryPrice = strategy.opentrades.entry_price(strategy.opentrades - 1)

//STOP LOSS - LONG POSITIONS 
var float sl = na

//CALCULTE SL WITH ATR AT ENTRY PRICE - LONG POSITION
if (strategy.position_size[1] != strategy.position_size)
    sl := lastEntryPrice - (_atr * sl_atr_multiplier)

//IN TRADE - LONG POSITIONS
inTrade = strategy.position_size > 0

//PLOT SL - LONG POSITIONS
plot(inTrade ? sl : na, color=color.blue, style=plot.style_circles, title="Long Position - Stop Loss")

//CALCULATE ORDER SIZE - LONG POSITIONS
positionSize = (strategy.equity * i_pctStop) / (_atr * sl_atr_multiplier)

//============================================================================================

//STOP LOSS - SHORT POSITIONS 
var float sl_short = na

//CALCULTE SL WITH ATR AT ENTRY PRICE - SHORT POSITIONS 
if (strategy.position_size[1] != strategy.position_size)
    sl_short := lastEntryPrice + (_atr * sl_atr_multiplier_short)

//IN TRADE SHORT POSITIONS
inTrade_short = strategy.position_size < 0

//PLOT SL - SHORT POSITIONS
plot(inTrade_short ? sl_short : na, color=color.red, style=plot.style_circles, title="Short Position - Stop Loss")

//CALCULATE ORDER - SHORT POSITIONS
positionSize_short = (strategy.equity * i_pctStop) / (_atr * sl_atr_multiplier_short) 


//===============================================

//LONG STRATEGY
strategy.entry("Long", strategy.long, comment="Long", when = long_entry and not short_entry, qty=positionSize)
if (strategy.position_size > 0)
    strategy.close("Long", when = (long_exit), comment="Close Long")
    strategy.exit("Long", stop = sl, comment="Exit Long")

//SHORT STRATEGY
strategy.entry("Short", strategy.short, comment="Short", when = short_entry and not long_entry, qty=positionSize_short)
if (strategy.position_size < 0) 
    strategy.close("Short", when = (short_exit), comment="Close Short")
    strategy.exit("Short", stop = sl_short, comment="Exit Short")

//ONE DIRECTION TRADING COMMAND (BELLOW ONLY ACTIVATE TO CORRECT BUGS)
//strategy.risk.allow_entry_in(strategy.direction.long)


More