概述
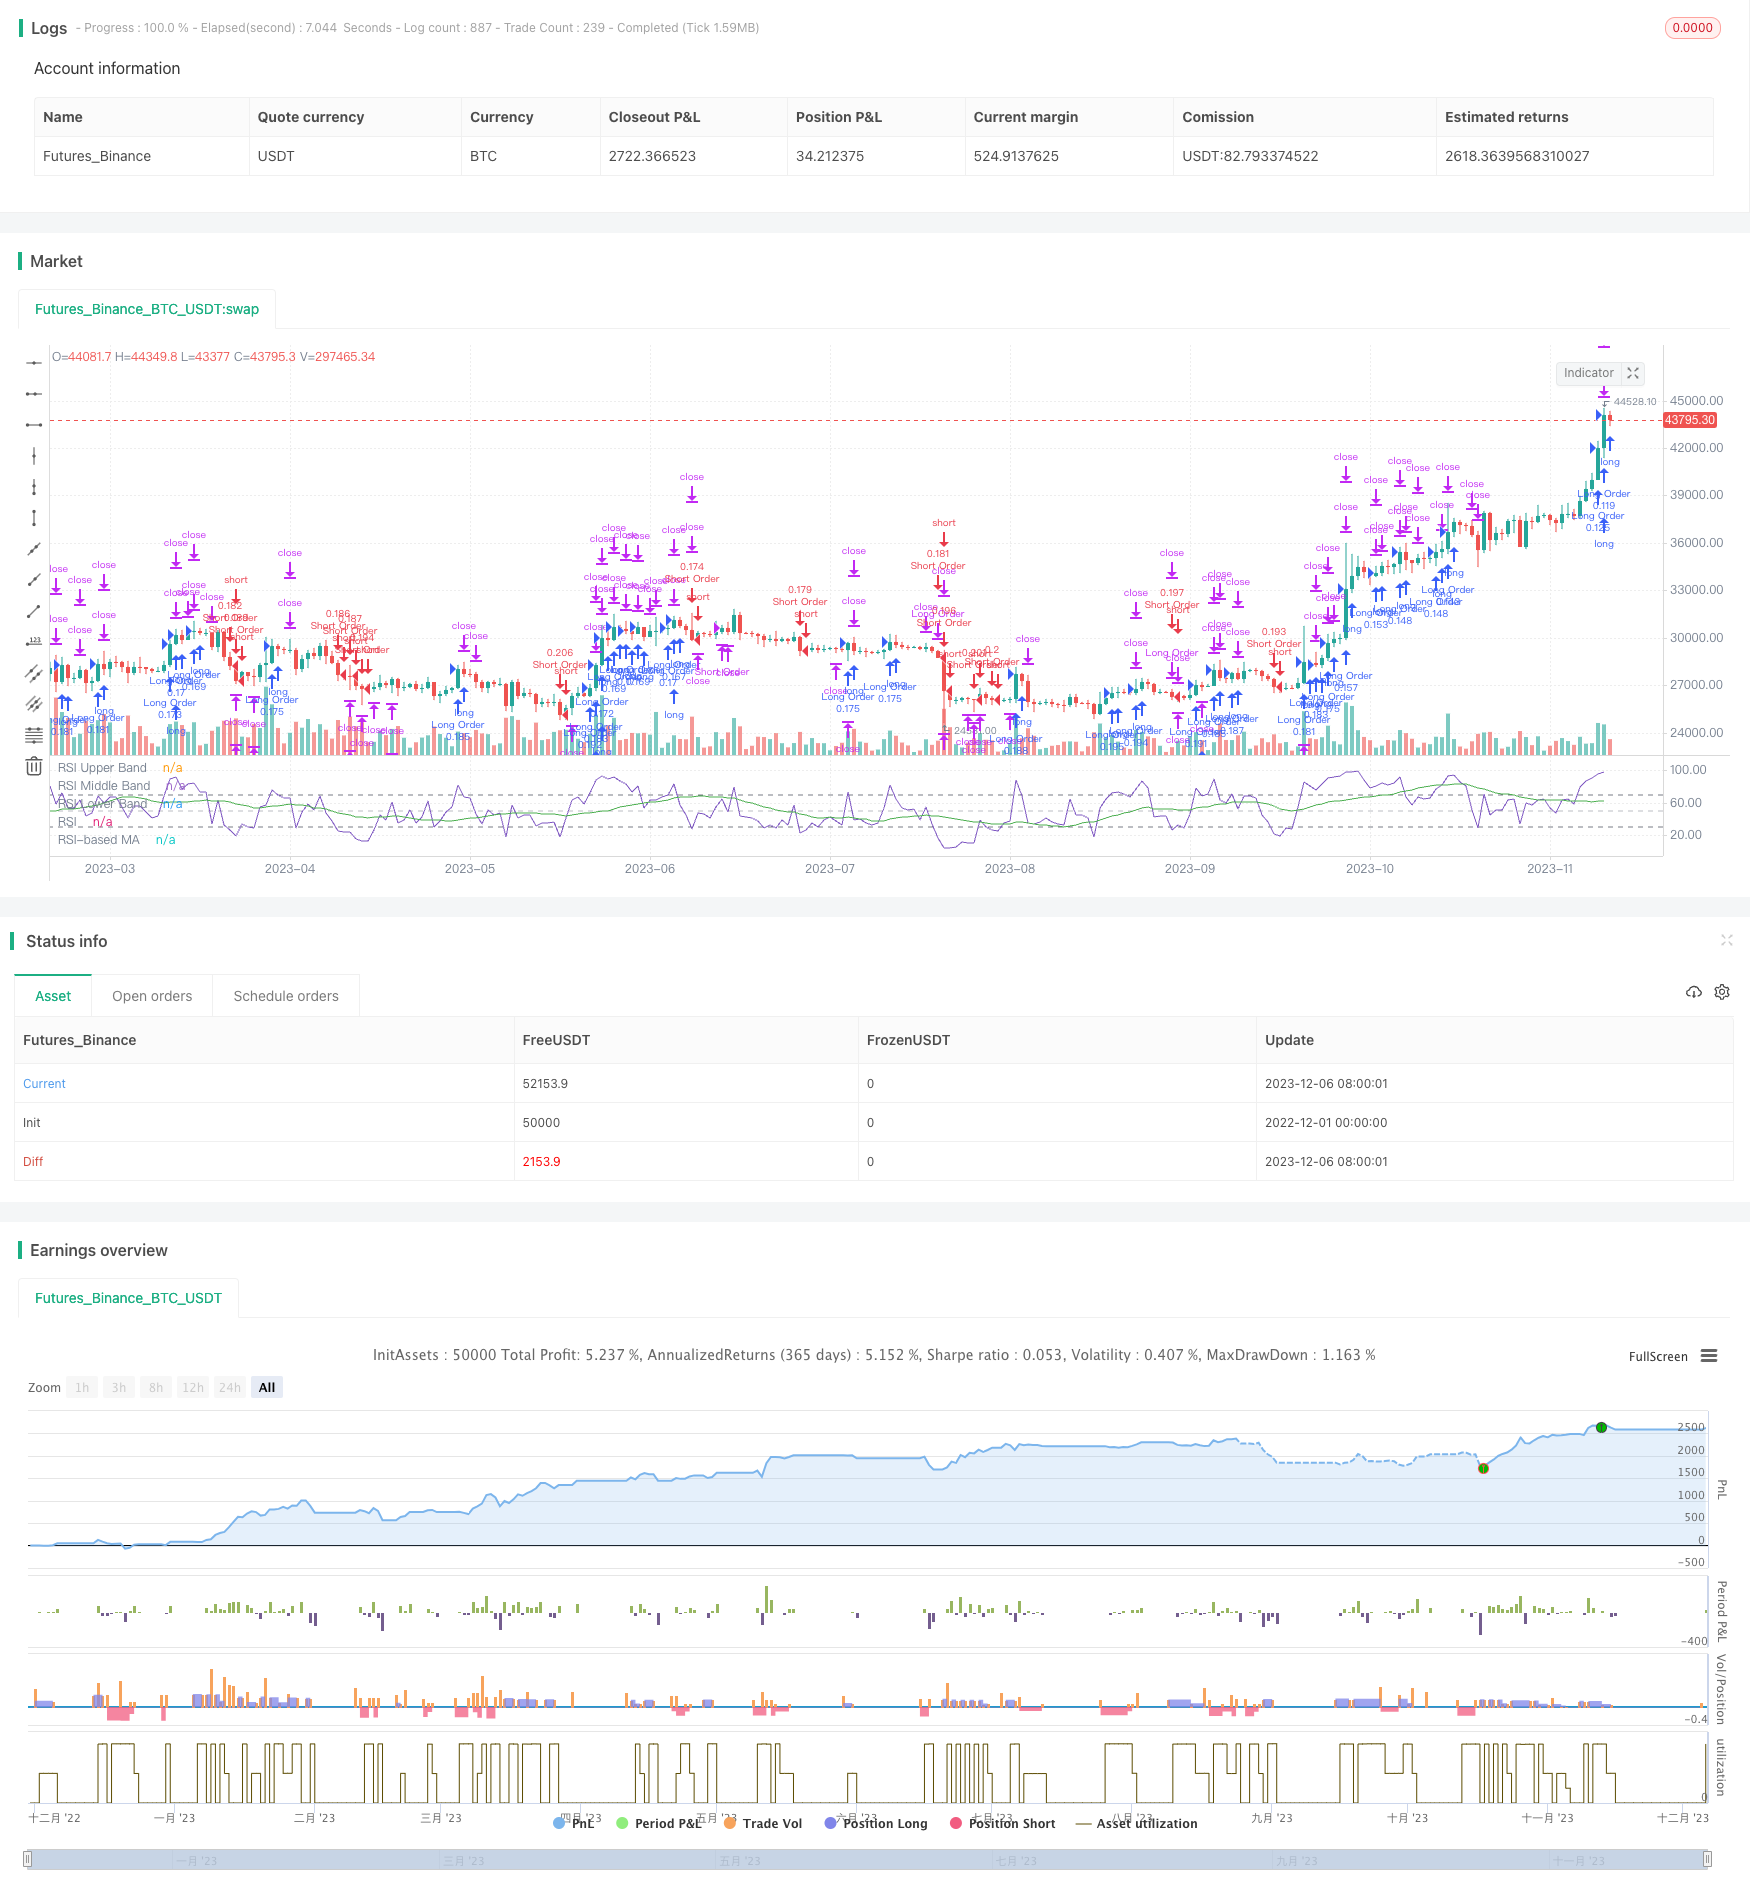
该策略是一个利用RSI指标识别趋势,并结合移动均线进行趋势确认,设置止损止盈的自动交易策略。当RSI大于68并且当前移动平均线上穿之前移动平均线时,做多;当RSI小于28并且当前移动平均线下穿之前移动平均线时,做空。同时设置止损止盈点。
策略原理
该策略主要利用RSI指标判断超买超卖现象识别趋势。当RSI大于70时为超买区,小于30时为超卖区。结合移动平均线的黄金交叉和死亡交叉进行趋势确认。具体交易信号为:
多头信号:RSI大于68并且当前移动平均线上穿之前移动平均线,做多。 空头信号:RSI小于28并且当前移动平均线下穿之前移动平均线,做空。
止损止盈设置为每个点位设置不同的止损止盈比例,从更为宽松到更严格,具体为:
多头止盈:高点的1.4%止盈一半仓位,高点的0.8%止盈全部平仓。 多头止损:入场价的2%设止损。
空头止盈:低点的0.4%止盈一半仓位,低点的0.8%止盈全部平仓。
空头止损:入场价的2%设止损。
同时当趋势反转时,例如做多时RSI下破30就市价全部平仓;做空时RSI上破60就市价全部平仓。
策略优势
- 使用RSI指标判断超买超卖现象,避免追高杀跌。
- 移动平均线进行趋势过滤,减少非主流方向操作。
- 递进止盈设定,让利润最大化。
- 较高止损点设定,给予趋势适当空间。
- 结合趋势转向指标的反向清仓策略,快速反应突发事件。
策略风险
- RSI参数设置问题,导致识别效果欠佳。
- 移动平均线参数设置问题,导致滤波效果不佳。
- 止损点过于宽松,亏损扩大的风险。
- 止盈点过于偏紧,盈利无法最大化。
- 反转清仓策略判断失误,造成不必要亏损。
针对以上风险,参数要多次测试优化。止损止盈设置要适当,宽松一定区间,并视市场波动度调整参数。清仓策略要审慎,避免因指标误判带来损失。
优化方向
可以从以下几个方面进一步优化:
- 增加更多滤波指标,提高信号准确率。例如增设交易量过滤。
- 调整止损策略,追踪最高价最低价,实现移动止损。
- 调整部分止盈为跟踪止盈,让利润最大化。
- 增加数据源切换,不同品种使用不同周期等参数组合。
- 增加期货空仓持有成本考量,动态调整止损止盈。
总结
该策略整体是一个较为成熟可靠的趋势跟踪策略。利用RSI判断超买超卖现象确定交易方向。运用移动平均线进行滤波确认。同时设置恰当的止损和递进止盈。能够在趋势中获得较好收益。如果参数调优到位,在趋势行情中表现优异。通过进一步优化后可以获得更出色表现。
策略源码
// © CRabbit
//@version=5

// Starting with $100 and using 10% of the account per trade
strategy("RSI Template", shorttitle="RSI", overlay=false, initial_capital=100, default_qty_value=10, default_qty_type=strategy.percent_of_equity)

// RSI Indicator
ma(source, length, type) =>
    switch type
        "SMA" => ta.sma(source, length)
        "Bollinger Bands" => ta.sma(source, length)
        "EMA" => ta.ema(source, length)
        "SMMA (RMA)" => ta.rma(source, length)
        "WMA" => ta.wma(source, length)
        "VWMA" => ta.vwma(source, length)

rsiLengthInput = input.int(4, minval=1, title="RSI Length", group="RSI Settings")
rsiSourceInput = input.source(close, "Source", group="RSI Settings")
maTypeInput = input.string("SMA", title="MA Type", options=["SMA", "Bollinger Bands", "EMA", "SMMA (RMA)", "WMA", "VWMA"], group="MA Settings")
maLengthInput = input.int(23, title="MA Length", group="MA Settings")
bbMultInput = input.float(2.0, minval=0.001, maxval=50, title="BB StdDev", group="MA Settings")

up = ta.rma(math.max(ta.change(rsiSourceInput), 0), rsiLengthInput)
down = ta.rma(-math.min(ta.change(rsiSourceInput), 0), rsiLengthInput)
rsi = down == 0 ? 100 : up == 0 ? 0 : 100 - (100 / (1 + up / down))
rsiMA = ma(rsi, maLengthInput, maTypeInput)
isBB = maTypeInput == "Bollinger Bands"

plot(rsi, "RSI", color=#7E57C2)
plot(rsiMA, "RSI-based MA", color=color.green)
rsiUpperBand = hline(70, "RSI Upper Band", color=#787B86)
hline(50, "RSI Middle Band", color=color.new(#787B86, 50))
rsiLowerBand = hline(30, "RSI Lower Band", color=#787B86)
fill(rsiUpperBand, rsiLowerBand, color=color.rgb(126, 87, 194, 90), title="RSI Background Fill")


// Configure backtest start date with inputs
startDate = input.int(title="Start Date", defval=1, minval=1, maxval=31)
startMonth = input.int(title="Start Month", defval=6, minval=1, maxval=12)
startYear = input.int(title="Start Year", defval=2022, minval=1800, maxval=2100)

// See if this bar's time happened on/after start date
afterStartDate = (time >= timestamp(syminfo.timezone,
     startYear, startMonth, startDate, 0, 0))


// Long and Short buy strategy
// Submit a market open/ close Long order, but only on/after start date
if (afterStartDate)
    if rsi > 68 and (rsiMA > rsiMA[1])
        strategy.entry("Long Order", strategy.long, comment="ENTER-LONG")
    if rsi < 30
        strategy.close("Long Order", alert_message="L-CL")

strategy.exit("L-TP1", from_entry="Long Order", limit=high * 1.004, qty_percent=50, alert_message="L-TP1" + str.tostring(high * 1.004))
strategy.exit("L-TP2", from_entry="Long Order", limit=high * 1.008, qty_percent=100, alert_message="L-TP2" + str.tostring(high * 1.008))
strategy.exit("Exit Long", from_entry="Long Order", stop=low * 0.98, alert_message="L-SL" + str.tostring(low * 0.98))


// Submit a market Open/ Close Short order, but only on/after start date
if (afterStartDate)
    if rsi < 28 and (rsiMA < rsiMA[1])
        strategy.entry("Short Order", strategy.short, comment="ENTER-SHORT")
    if rsi > 60
        strategy.close("Short Order", alert_message="S-CL")

strategy.exit("S-TP1", from_entry="Short Order", limit=low * 0.996, qty_percent=50, alert_message="S-TP1" + str.tostring(low * 0.996))
strategy.exit("S-TP2", from_entry="Short Order", limit=low * 0.992, qty_percent=100, alert_message="S-TP2" + str.tostring(low * 0.992))
strategy.exit("Exit Short", from_entry="Short Order", stop=high * 1.02, alert_message="S-SL" + str.tostring(high * 1.02))

// MONTHLY TABLE //

prec      = input(2, title = "Return Precision")

new_month = month(time) != month(time[1])
new_year  = year(time)  != year(time[1])

eq = strategy.equity

bar_pnl = eq / eq[1] - 1

cur_month_pnl = 0.0
cur_year_pnl  = 0.0

// Current Monthly P&L
cur_month_pnl := new_month ? 0.0 :
                 (1 + cur_month_pnl[1]) * (1 + bar_pnl) - 1

// Current Yearly P&L
cur_year_pnl := new_year ? 0.0 :
                 (1 + cur_year_pnl[1]) * (1 + bar_pnl) - 1

// Arrays to store Yearly and Monthly P&Ls
var month_pnl  = array.new_float(0)
var month_time = array.new_int(0)

var year_pnl  = array.new_float(0)
var year_time = array.new_int(0)

if (not na(cur_month_pnl[1]) and (new_month or barstate.islast))
    array.push(month_pnl , cur_month_pnl[1])
    array.push(month_time, time[1])

if (not na(cur_year_pnl[1]) and (new_year or barstate.islast))
    array.push(year_pnl , cur_year_pnl[1])
    array.push(year_time, time[1])

// Monthly P&L Table
var monthly_table = table(na)

if (barstate.islast)
    monthly_table := table.new(position.bottom_right, columns = 14, rows = array.size(year_pnl) + 1, border_width = 1)

    table.cell(monthly_table, 0,  0, "",     bgcolor = #cccccc)
    table.cell(monthly_table, 1,  0, "Jan",  bgcolor = #cccccc)
    table.cell(monthly_table, 2,  0, "Feb",  bgcolor = #cccccc)
    table.cell(monthly_table, 3,  0, "Mar",  bgcolor = #cccccc)
    table.cell(monthly_table, 4,  0, "Apr",  bgcolor = #cccccc)
    table.cell(monthly_table, 5,  0, "May",  bgcolor = #cccccc)
    table.cell(monthly_table, 6,  0, "Jun",  bgcolor = #cccccc)
    table.cell(monthly_table, 7,  0, "Jul",  bgcolor = #cccccc)
    table.cell(monthly_table, 8,  0, "Aug",  bgcolor = #cccccc)
    table.cell(monthly_table, 9,  0, "Sep",  bgcolor = #cccccc)
    table.cell(monthly_table, 10, 0, "Oct",  bgcolor = #cccccc)
    table.cell(monthly_table, 11, 0, "Nov",  bgcolor = #cccccc)
    table.cell(monthly_table, 12, 0, "Dec",  bgcolor = #cccccc)
    table.cell(monthly_table, 13, 0, "Year", bgcolor = #999999)


    for yi = 0 to array.size(year_pnl) - 1
        table.cell(monthly_table, 0,  yi + 1, str.tostring(year(array.get(year_time, yi))), bgcolor = #cccccc)

        y_color = array.get(year_pnl, yi) > 0 ? color.new(color.green, transp = 50) : color.new(color.red, transp = 50)
        table.cell(monthly_table, 13, yi + 1, str.tostring(math.round(array.get(year_pnl, yi) * 100, prec)), bgcolor = y_color)

    for mi = 0 to array.size(month_time) - 1
        m_row   = year(array.get(month_time, mi))  - year(array.get(year_time, 0)) + 1
        m_col   = month(array.get(month_time, mi))
        m_color = array.get(month_pnl, mi) > 0 ? color.new(color.green, transp = 70) : color.new(color.red, transp = 70)

        table.cell(monthly_table, m_col, m_row, str.tostring(math.round(array.get(month_pnl, mi) * 100, prec)), bgcolor = m_color)