Crossing Strategy Between Bollinger Bands and Hull Indicator

Summary
This strategy generates trading signals based on the crossover between Bollinger Bands and the Hull indicator. It goes long when the Hull indicator crosses above the lower band of Bollinger Bands, and goes short when the Hull indicator crosses below the upper band of Bollinger Bands. The strategy combines the breakout strategy of Bollinger Bands and the trend-following strategy of the Hull indicator to utilize the advantages of both.
Principles
The strategy mainly uses the crossover between Bollinger Bands and the Hull indicator to generate trading signals.
Bollinger Bands contain three lines: middle line, upper line and lower line. The middle line is the N-day moving average, while the upper and lower lines are middle line ± standard deviation. If price breaks through the upper line, it indicates a breakthrough opportunity; if price breaks through the lower line, it indicates a callback opportunity.
The Hull indicator is a trend-following indicator. It uses the difference between two weighted moving averages of different periods to determine the current trend. If the short period moving average is above the long period one, it indicates an uptrend, and vice versa.
The strategy combines the strengths of both indicators. When the Hull indicator crosses above the lower band of Bollinger Bands, it is considered that stock price may enter an uptrend, so go long. When the Hull indicator crosses below the upper band, it is considered that stock price may enter a downward callback, so go short.
Advantages
-
Combines the strengths of Bollinger Bands and Hull indicator to make trading signals more reliable.
-
Uses Hull indicator to determine trend direction and Bollinger Bands to determine support/resistance levels, generating crossover signals to improve profitability.
-
Parameters of both indicators can be optimized for stocks of different cycles to expand applicability.
Risks and Solutions
-
The strategy may generate more false signals during range-bound movements, causing losses. Parameters can be optimized or filters can be added to reduce false signals.
-
Prices may fluctuate violently, causing both indicators to issue signals simultaneously. Ensure signal sequencing to avoid erroneous crossover signal judgment. Consider adding stop loss to control losses.
-
Strategy sets position size to 100% directly. In actual deployment, position sizing needs to be adjusted to avoid magnified losses due to full position opening.
Optimization Directions
-
Test and optimize parameters of both indicators to adapt to more stock cycles.
-
Add filters like trading volume or volatility to avoid wrong signals during consolidation.
-
Optimize stop loss strategies by setting trailing stop loss or stop limit orders.
-
Adjust position sizing rules by adding re-entry conditions to avoid loss magnification.
Conclusion
This strategy combines the breakout strategy of Bollinger Bands and trend-following strategy of the Hull indicator by using crossover signals between them to achieve both trend-following and breakout effects. The strategy has strong adaptability to medium- and short-term stocks given no major fundamental changes. But parameters, position sizing, stop loss strategies still need optimization during actual deployment to make the strategy more robust.
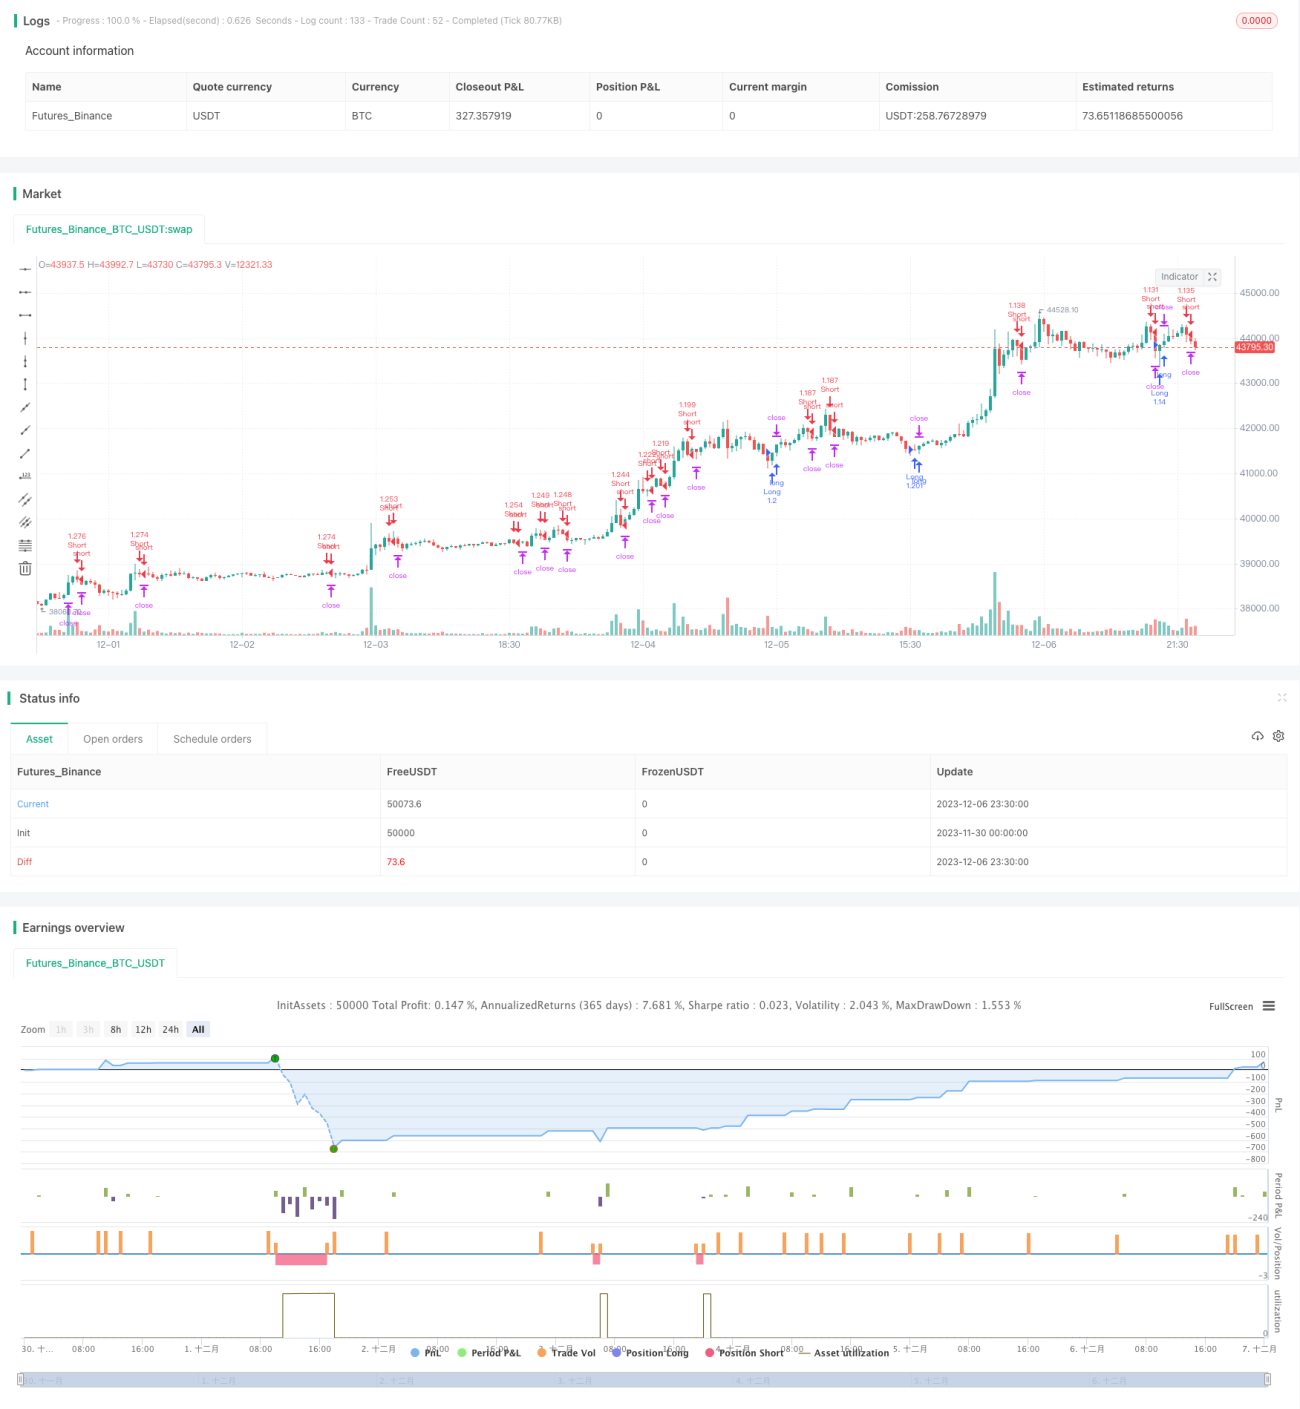
/*backtest
start: 2023-11-30 00:00:00
end: 2023-12-07 00:00:00
period: 30m
basePeriod: 15m
exchanges: [{"eid":"Futures_Binance","currency":"BTC_USDT"}]
*/


//@version=3
strategy(title="Strategy Hull Bollinger", shorttitle="Hull bollinger",overlay=true, calc_on_order_fills=true, default_qty_type=strategy.percent_of_equity, default_qty_value=100, overlay=false)
- 1