Quantitative Trading Strategy Integrating Reversal and Future Lines of Demarcation

Overview
This strategy integrates the 123 reversal strategy and future lines of demarcation (FLD) strategy to implement a quantitative trading strategy that enters or exits positions when both strategies generate signals simultaneously. It is mainly applied to index futures markets, capturing opportunities from combinations of short-term reversal signals and medium-long term trend signals for medium-short term holding trades.
Principles
123 Reversal Strategy
The 123 reversal strategy originates from the book "How I Tripled My Money in the Futures Market". It goes long when the closing price shows reversal patterns for two continuous days and the 9-day slow stochastics is below 50; It goes short when the closing price shows reversal patterns for two continuous days and the 9-day fast stochastics is above 50.
Future Lines of Demarcation Strategy
The future lines of demarcation (FLD) strategy is a trend-following strategy based on the periodicity of price fluctuations. FLD lines are plotted by shifting the median, high or low prices approximately half a cycle into the future. Trading signals are generated when prices cross the FLD lines.
Advantage Analysis
This strategy combines reversal and trend-following strategies, capturing both short-term reversal opportunities and medium-long term trend directions on multiple time frames for quantitative trading. The reversal element provides short-term profit-taking chances while the trend-following part ensures the overall trading aligns with the trend, effectively controlling trading risks. Moreover, the adaptive nature of FLD also enhances the stability of the strategy.
Risk Analysis
The main risks of this strategy come from false breakouts of reversal signals and errors in FLD line judgments. For the former, parameters can be adjusted to confirm reversal signals or add other auxiliary indicators to improve accuracy. For the latter, parameters need to be optimized to ensure FLD describes market cycles more precisely. Additionally, mistakes of FLD when major trend reversals occur should also be watched out for.
Optimization Directions
- Improve reversal strategy by adding other indicators to filter signals and decrease false breakout possibilities
- Compare different FLD parameters to better describe cyclical patterns
- Add stop loss logic to control single loss risks
- Test parameter effectiveness across different products
Conclusion
This strategy combines reversal and trend-following concepts for stable profits over medium-short term time frames. Future optimizations in aspects of signal accuracy, trend description capability and risk control will expand its parameter universe and improve stability.
/*backtest
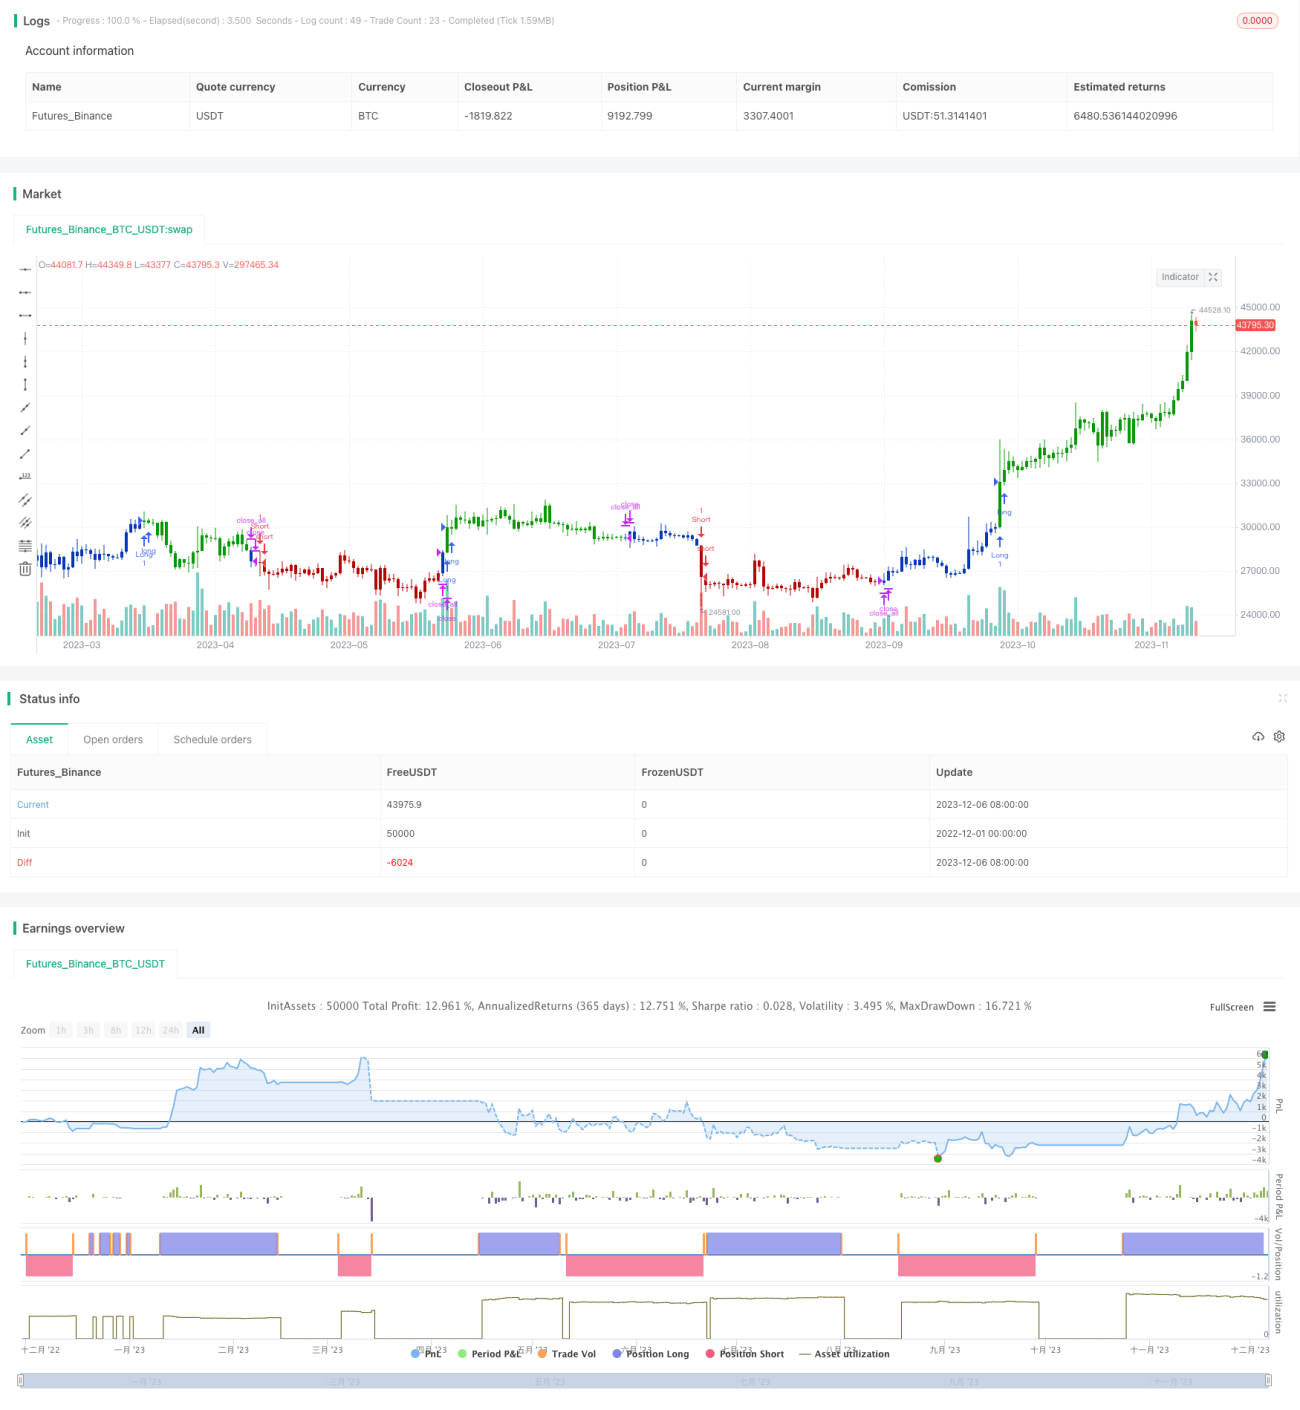
start: 2022-12-01 00:00:00
end: 2023-12-07 00:00:00
period: 1d
basePeriod: 1h
exchanges: [{"eid":"Futures_Binance","currency":"BTC_USDT"}]
*/
//@version=4
////////////////////////////////////////////////////////////
// Copyright by HPotter v1.0 28/08/2020
// This is combo strategies for get a cumulative signal. - 1