Moving Average Bollinger Bands Breakout Strategy

1
Follow
1778
Followers
Overview
This strategy combines moving average, Bollinger bands and UT Bot Alerts indicators to implement a simple breakout trading strategy. It goes long when price breaks above Bollinger upper band and goes short when price breaks below Bollinger lower band.
Strategy Logic
- The 200-period EMA serves as the baseline for the trend. Price above EMA signifies uptrend and price below EMA signifies downtrend.
- The UT Bot Alerts indicator generates buy and sell signals in combination with ATR. It triggers long signal when price and fast EMA cross above Bollinger upper band. And it triggers short signal when price and fast EMA cross below Bollinger lower band.
- The ATR stop loss indicator sets the stop loss points. The stop loss distance is 1.5 times the ATR value.
- After entry, stop loss, take profit and break even levels are determined by risk reward ratio.
Advantage Analysis
- Using Bollinger bands to identify appropriate long and short opportunities can improve profitability.
- The UT Bot Alerts indicator can generate comparatively accurate signals.
- By adopting risk reward ratio for stop loss and take profit, risk can be effectively controlled.
Risk Analysis
- Bollinger bands tend to produce false signals during ranging periods.
- ATR has lagging effect. At the beginning of a trend, the stop loss distance may be too wide.
- Improper risk reward ratio settings can also lead to over-aggressiveness or over-conservativeness.
Optimization Guidelines
- Try using other indicators to replace the UT Bot Alerts indicator.
- Optimize the period and multiplier parameters of ATR to find more suitable stop loss distance.
- Test different risk reward ratios to find the optimal parameters.
Conclusion
This strategy integrates the strengths of multiple indicators and has considerable practicality. Through parameter optimization, it can become a steady and reliable breakout system. But the risks arising from indicator failure and improper parameters should also be watched out for.
Source
Pine
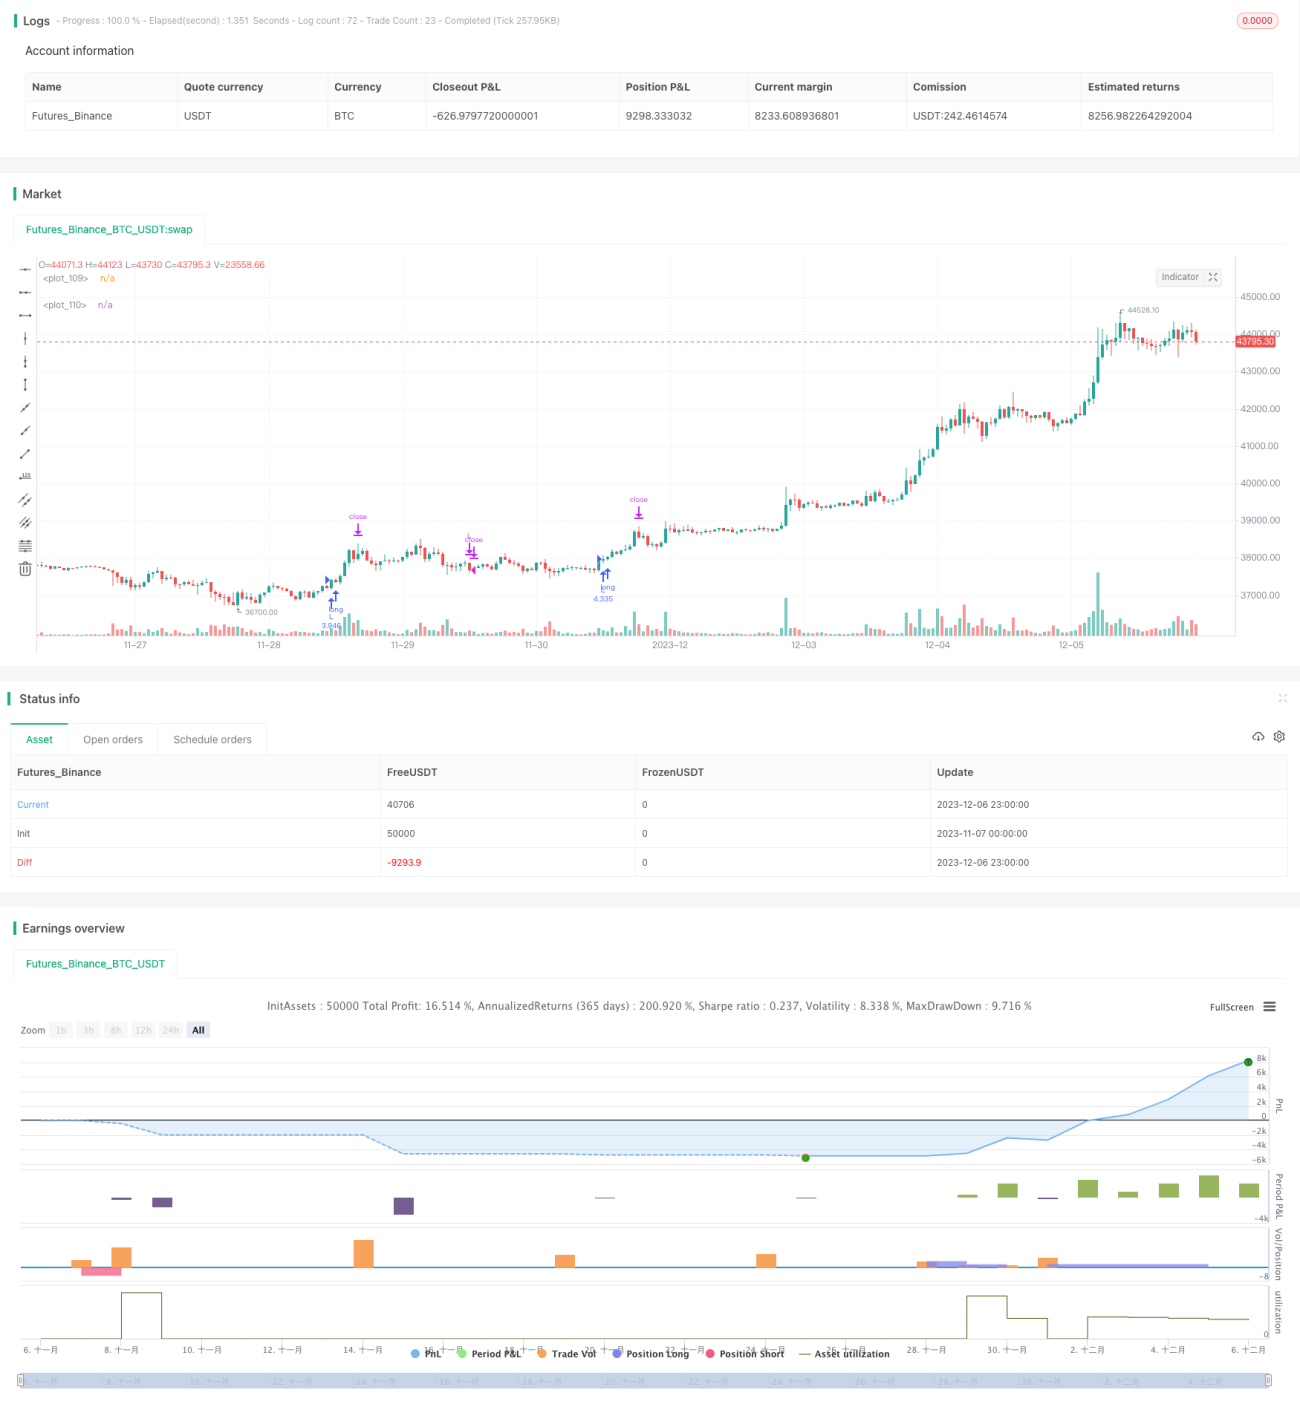
/*backtest
start: 2023-11-07 00:00:00
end: 2023-12-07 00:00:00
period: 1h
basePeriod: 15m
exchanges: [{"eid":"Futures_Binance","currency":"BTC_USDT"}]
*/

// This source code is subject to the terms of the Mozilla Public License 2.0 at https://mozilla.org/MPL/2.0/
//@version=5
//Developed by StrategiesForEveryone
Strategy parameters
Related strategies
Comment
All comments (0)
No data
- 1