Trend and Moving Average Crossover Based Multi-Functional Algorithmic Trading Strategy

Author: ChaoZhang, Date: 2023-12-08 12:14:50
Tags:

img

Overview

This strategy integrates multiple technical indicators and trading concepts to automatically generate buy and sell signals. The key features are optimizing stops based on trend indicators and triggering trades from moving average crossovers.

Strategy Logic

Technical Indicators

  • Custom UTSTC indicator: An adaptive trailing stop based on Average True Range to adjust stop loss range according to market volatility.

  • STC indicator: The difference between fast and slow simple moving averages to determine market trend direction and potential reversal points.

  • Simple Moving Averages (SMA) and Exponential Moving Averages (EMA): Plotting moving averages of different periods to provide additional trend information.

Trading Signals

  • Buy signal: Generated when close price crosses above UTSTC line and STC is in bullish state.

  • Sell signal: Generated when close price crosses below UTSTC line and STC is in bearish state.

Advantages

  • Integrates multiple indicators to determine market trend, improving signal accuracy.

  • UTSTC adjusts stops automatically based on true volatility, effectively controlling loss per trade.

  • Simple and effective trading signals from moving average crosses.

  • Different parameter combinations accommodate more market environments.

Risks

  • Trend indicators like STC may lag and miss short-term reversals.

  • Moving average crosses may generate false signals.

  • Careful assessment of parameters required, improper combinations may reduce profits or increase losses.

  • Stop loss range too wide may increase losses, too tight may stop out early.

Enhancement Opportunities

  • Test different STC lengths to find settings with minimal strategy impact.

  • Incorporate additional filters to reduce false signals e.g. KDJ, MACD.

  • Optimize stops based on backtest results to find best parameter mix.

  • Evaluate different holding periods to determine optimal.

Conclusion

This strategy combines trend, automated stops and signal modules into a rather complete algorithmic trading framework. With parameter tuning and feature expansion, stable profits may be achieved but no strategy can fully avoid losses. Proper validation and risk control is still essential.
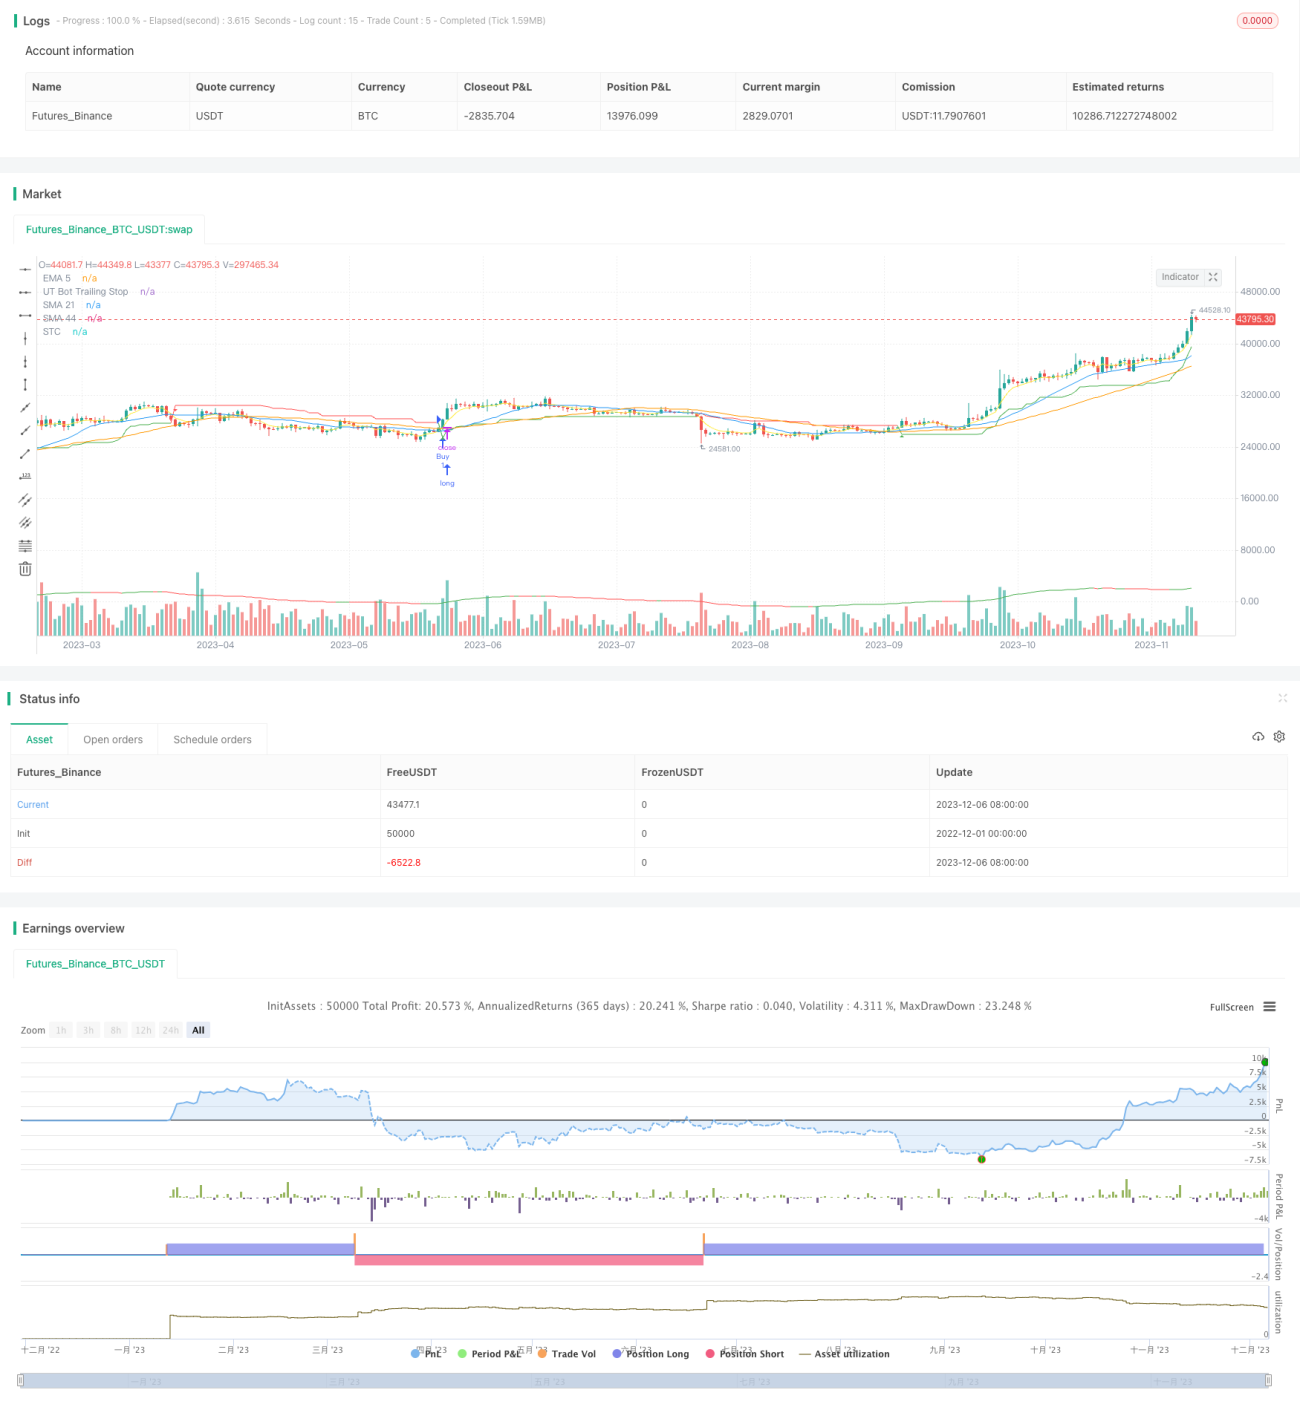

/*backtest
start: 2022-12-01 00:00:00
end: 2023-12-07 00:00:00
period: 1d
basePeriod: 1h
exchanges: [{"eid":"Futures_Binance","currency":"BTC_USDT"}]
*/

//@version=4
strategy("OB+LQ+UTSTC+SMA+EMA-NORA-MIP21-Jashore-Bangladesh-OneMinuteTF", shorttitle="OB+LS+UTSTC-MIP21-Jashore-Bangladesh-OneMinuteTF", overlay=true)

// Order Block + Liquidity Swings [NORA] Settings
pivot_length = input(14, title="Pivot Lookback")
bull_ext_last = input(3, title="Bullish OB Extension")
bear_ext_last = input(3, title="Bearish OB Extension")
swing_length = input(5, title="Swing Length")
area = input("Wick Extremity", title="Swing Area", options=["Wick Extremity", "Full Range"])
min_profit = input(0.5, title="Minimum Profit Target")
max_loss = input(0.5, title="Maximum Loss Stop")

// Variables
var float bull_ob_price = na
var float bear_ob_price = na
var float swing_high = na
var float swing_low = na

// Calculate Order Block Prices
var float low_lowest = na
var float high_highest = na
if bar_index >= pivot_length
    low_lowest := lowest(low, pivot_length)
    high_highest := highest(high, pivot_length)
    bull_ob_price := low_lowest
    bear_ob_price := high_highest

// Calculate Swing High/Low Prices
var float low_lowest_swing = na
var float high_highest_swing = na

if area == "Wick Extremity"
    low_lowest_swing := lowest(low, swing_length)
    high_highest_swing := highest(high, swing_length)
else
    low_lowest_swing := lowest(high - low, swing_length)
    high_highest_swing := highest(high - low, swing_length)

swing_low := low_lowest_swing
swing_high := high_highest_swing

// Trading Logic for Order Block + Liquidity Swings
buy_liquidity = crossover(close, bull_ob_price) and close > swing_low
sell_liquidity = crossunder(close, bear_ob_price) and close < swing_high

// Plot Buy/Sell Signals for Order Block + Liquidity Swings
plotshape(series=buy_liquidity, style=shape.labelup, location=location.belowbar, color=color.rgb(39, 166, 175), size=size.small, title="Bullish LQ")
plotshape(series=sell_liquidity, style=shape.labeldown, location=location.abovebar, color=color.rgb(248, 95, 215), size=size.small, title="Bearish LQ")

// UTSTC-SMA-EMA-NORA-New Settings
keyvalue = input(3, title="UT Bot Key Value", step=0.5)
atrperiod = input(10, title="UT Bot ATR Period")
src = close

xATR = atr(atrperiod)
nLoss = keyvalue * xATR
xATRTrailingStop = 0.0
xATRTrailingStop := iff(src > nz(xATRTrailingStop[1], 0) and src[1] > nz(xATRTrailingStop[1], 0), max(nz(xATRTrailingStop[1]), src - nLoss),
   iff(src < nz(xATRTrailingStop[1], 0) and src[1] < nz(xATRTrailingStop[1], 0), min(nz(xATRTrailingStop[1]), src + nLoss), 
   iff(src > nz(xATRTrailingStop[1], 0), src - nLoss, src + nLoss)))
pos = 0   
pos := iff(src[1] < nz(xATRTrailingStop[1], 0) and src > nz(xATRTrailingStop[1], 0), 1,
   iff(src[1] > nz(xATRTrailingStop[1], 0) and src < nz(xATRTrailingStop[1], 0), -1, nz(pos[1], 0))) 
xcolor = pos == -1 ? color.red: pos == 1 ? color.green : color.blue
plot(xATRTrailingStop, color=xcolor, title="UT Bot Trailing Stop")

// STC Settings
stc_length = input(12, title="STC Length")
fastLength = input(26, title="STC Fast Length")
slowLength = input(50, title="STC Slow Length")
fastMA = ema(close, fastLength)
slowMA = ema(close, slowLength)
STC = fastMA - slowMA
STCColor = STC > STC[1] ? color.green : color.red
plot(STC, color=STCColor, title="STC")

// Add SMAs
sma21 = sma(close, 21)
sma44 = sma(close, 44)
plot(sma21, color=color.blue, title="SMA 21")
plot(sma44, color=color.orange, title="SMA 44")

// Add EMA
ema5 = ema(close, 5)
plot(ema5, color=color.yellow, title="EMA 5")

// Combined Strategy
buySignal = crossover(src, xATRTrailingStop) and STC < 25 and STCColor == color.green
sellSignal = crossunder(src, xATRTrailingStop) and STC > 75 and STCColor == color.red

// Plot Buy and Sell signals as triangles
plotshape(series=buySignal, title="Buy Signal", location=location.belowbar, color=color.green, style=shape.triangleup, size=size.small)
plotshape(series=sellSignal, title="Sell Signal", location=location.abovebar, color=color.red, style=shape.triangledown, size=size.small)

strategy.entry("Buy", strategy.long, when=buySignal)
strategy.entry("Sell", strategy.short, when=sellSignal)


More