Price Channel and MACD Based Multi Timeframe Trading Strategy

Overview
This strategy combines price channel indicator and MACD indicator to track trends and identify overbought and oversold levels across multiple timeframes, thereby making buy and sell decisions. The strategy also incorporates stop loss and take profit to manage risks.
Strategy Logic
The price channel indicator constructs a price channel based on EMA lines of highest and lowest prices to determine trends when price breaks out of the channel. The MACD indicator judges bullish and bearish momentum. Values above zero line suggest a bull market while values below suggest a bear market.
The trading signals of this strategy come from the following aspects:
-
Enter long when MACD histogram flips red. Enter short when MACD histogram flips green.
-
Enter short when price approaches the bottom of the channel and MACD is below zero line.
-
Enter long when price approaches the top of the channel and MACD is above zero line.
-
Enter long when MACD crosses above zero line. Enter short when MACD crosses below zero line.
Exits are triggered by stop loss and take profit.
Advantages of the Strategy
-
Combination of indicators prevents false breakout.
-
Combination of indicators across timeframes ensures reliable trend detection.
-
Incorporation of stop loss and take profit effectively controls per trade loss.
Risks of the Strategy
-
Limited optimization space leading to overoptimization.
-
Low setting of price channel misses larger moves.
-
Tight stop loss causes larger losses.
Solutions:
-
Adopt walk forward optimization to prevent overoptimization.
-
Set adaptive parameters for price channel.
-
Introduce volatility based stop loss for dynamic adjustment of stop distance.
Directions of Optimization
-
Optimize combination of MACD parameters.
-
Optimize adaptive calculation of price channel parameters.
-
Add more filters to prevent false breakouts and improve efficiency.
Summary
This strategy combines the strengths of price channel and MACD by reasonable parameter setups and large optimization space. It performs well in trend detection and overbought/oversold identification. The stop loss/take profit mechanism controls per trade loss. Going forwards, improvements can be made by parameters optimization, adding filters and optimizing the stop loss mechanism.
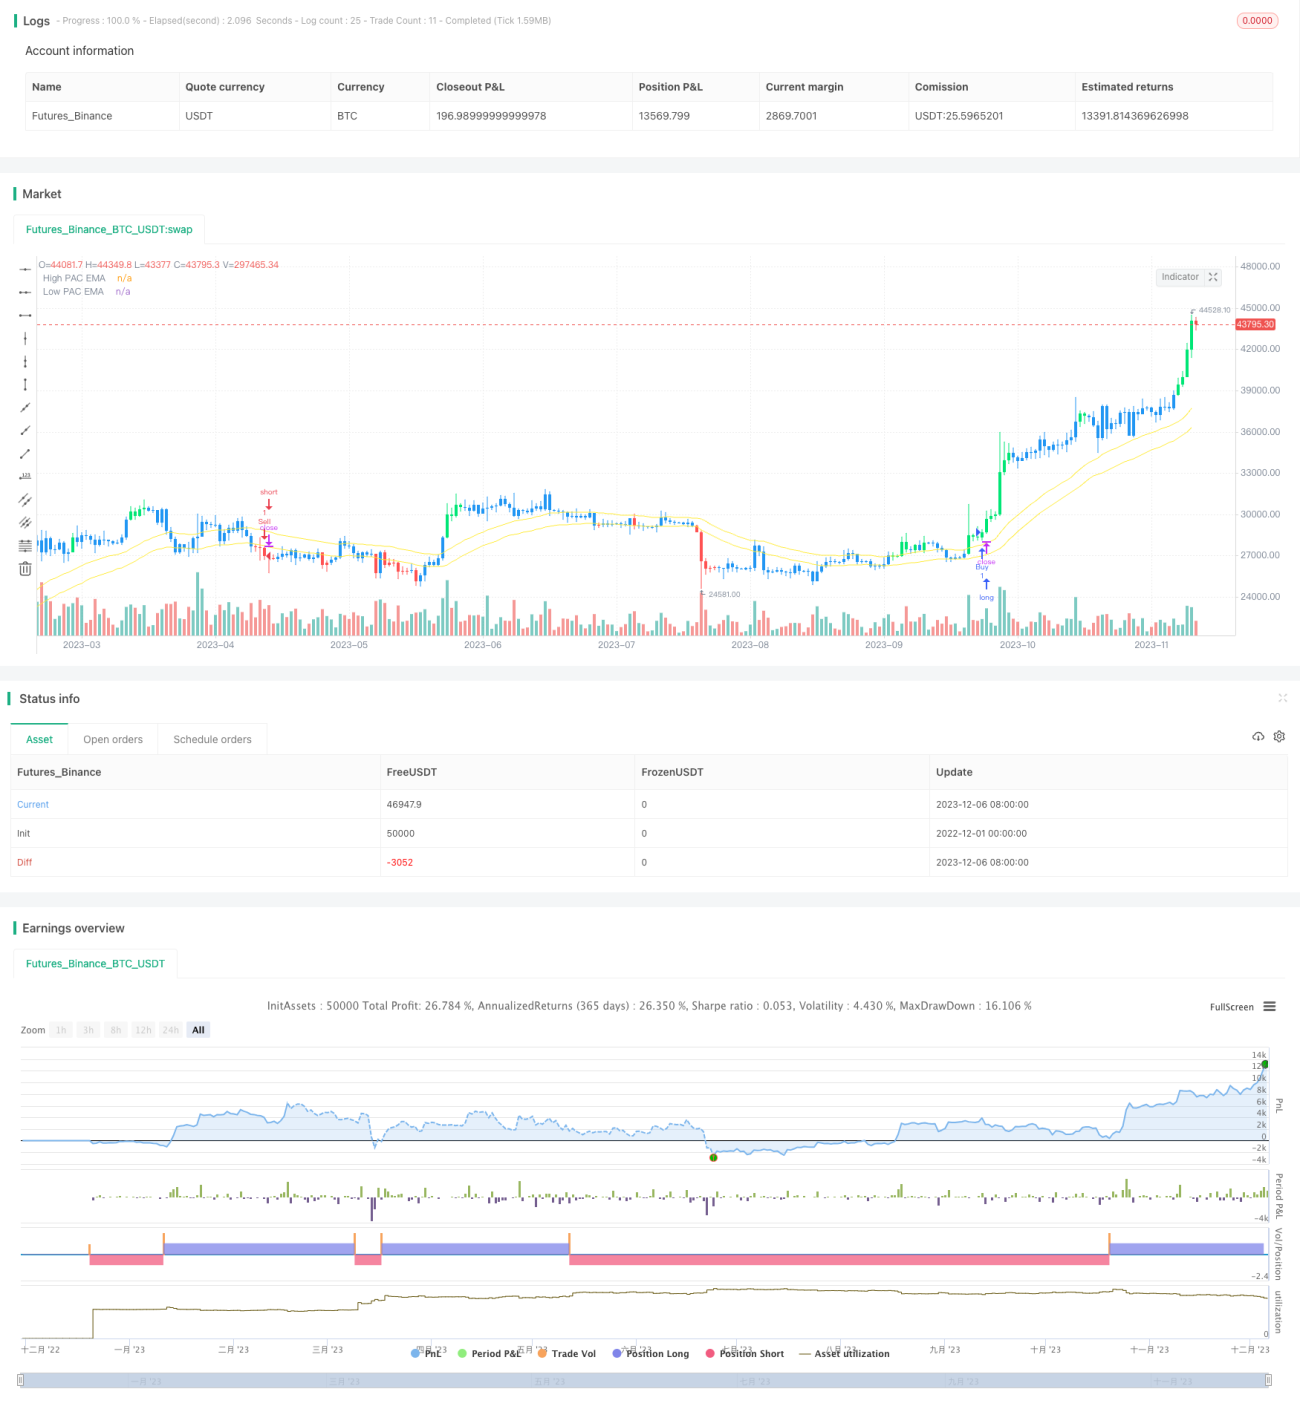
/*backtest
start: 2022-12-01 00:00:00
end: 2023-12-07 00:00:00
period: 1d
basePeriod: 1h
exchanges: [{"eid":"Futures_Binance","currency":"BTC_USDT"}]
*/

//@version=2
strategy("Sonic R + Barcolor MACD", overlay=true)
HiLoLen     = input(34, minval=2,title="High Low channel Length")
pacL = ema(low,HiLoLen)- 1