ADX-Based One-Hour TENKAN KIJUN Cross Trend Tracking Strategy

Overview
This is a simple yet profitable trend tracking strategy based on one-hour time frame TENKAN and KIJUN cross in the ICHIMOKU system combined with ADX indicator to filter out weak trending markets to generate trading signals. It works best on large market cap altcoin BTC pairs like ETH/BTC.
Strategy Logic
The strategy uses Conversion Line (TENKAN) and Base Line (KIJUN) cross in ICHIMOKU system to determine market trend direction. TENKAN line is calculated based on the average of highest high and lowest low of past 18 candles, representing fast conversion line. KIJUN line is based on 58 candle periods, standing for standard conversion line.
When TENKAN cross above KIJUN, it is a bullish signal. When TENKAN cross below KIJUN, it is a bearish signal. This aims to capture medium-term trend reversal.
In addition, ADX indicator is used to gauge the strength of the trend. Only when ADX is above 20, indicating a strong trend, will the signal be triggered.
In summary, this strategy identifies mid-term trend direction via TENKAN and KIJUN cross, and uses ADX to filter out false breakouts, in order to track long-term trends.
Advantage Analysis
The main advantages of this strategy are:
-
Using mature and reliable ICHIMOKU system to determine trend direction and turning points.
-
Filtering out weak trending market using ADX to avoid whipsaws in consolidation.
-
The one-hour timeframe filters market noise and only captures mid-to-long term trends.
-
The logic is straightforward and easy to follow for trend traders.
-
Solid backtesting results especially on high market cap coins like ETH/BTC.
Risk Analysis
Some risks to note about this strategy:
-
ICHIMOKU parameters are sensitive, needs customization for different pairs.
-
ADX may lag in some cases, causing missed entry.
-
Underperforms in ranging markets with frequent stop loss hit.
-
Performance varies greatly across different pairs and timeframes.
-
Long holding of positions can be risky, proper stop loss/take profit needed.
Optimization can be done via ADX parameter tuning, adding filters like MACD to reduce false signals, or dynamical adjustment of parameters for robustness.
Optimization Directions
Some major directions to improve the strategy:
-
Dynamic optimization of TENKAN and KIJUN parameters for better adaptation.
-
Searching for better trend indicators to replace or combine with ADX.
-
Adding stop loss/take profit to control risk/reward ratio.
-
Ensemble modeling with complementary indicators to improve stability.
-
Modularization and flexibility for parameter tuning on more pairs.
-
Quantitative risk management e.g. max drawdown control against extreme moves.
Conclusion
In conclusion, this is a simple yet practical trend tracking strategy, mainly based on TENKAN/KIJUN cross and ADX to identify mid-to-long term trends and generate signals. It has shown positive backtesting results, especially on high market cap BTC pairs like ETH/BTC, with relatively stable profitability. But it also relies on parameter tuning, requires per-pair optimization. Risk control per trade is also necessary to limit losses when trends reverse. Overall this offers valuable reference of a trend following strategy for algo traders.
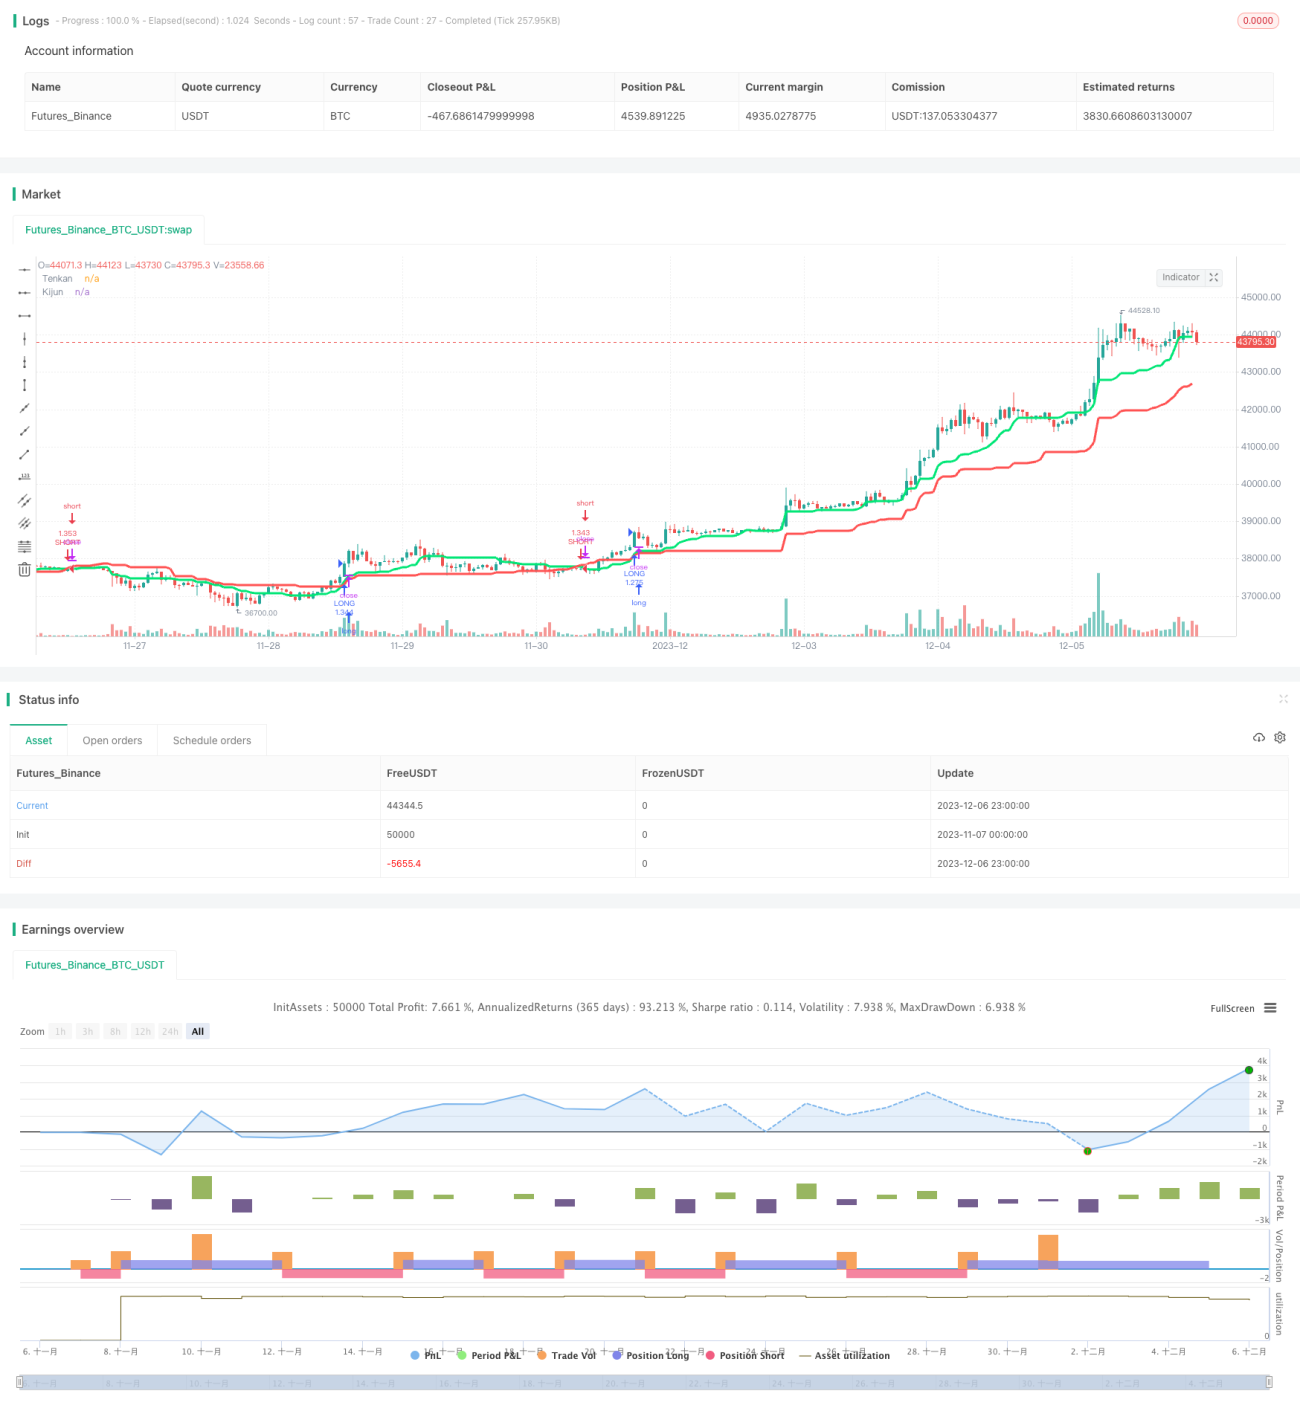
/*backtest
start: 2023-11-07 00:00:00
end: 2023-12-07 00:00:00
period: 1h
basePeriod: 15m
exchanges: [{"eid":"Futures_Binance","currency":"BTC_USDT"}]
*/

//@version=2
strategy(title="Odin's Kraken (TK Cross Strategy)", shorttitle="Odin's Kraken", overlay=true, default_qty_type=strategy.percent_of_equity, default_qty_value=100)

src = input(close, title="Source")- 1