Crypto Bull Run Tracking Strategy

Overview
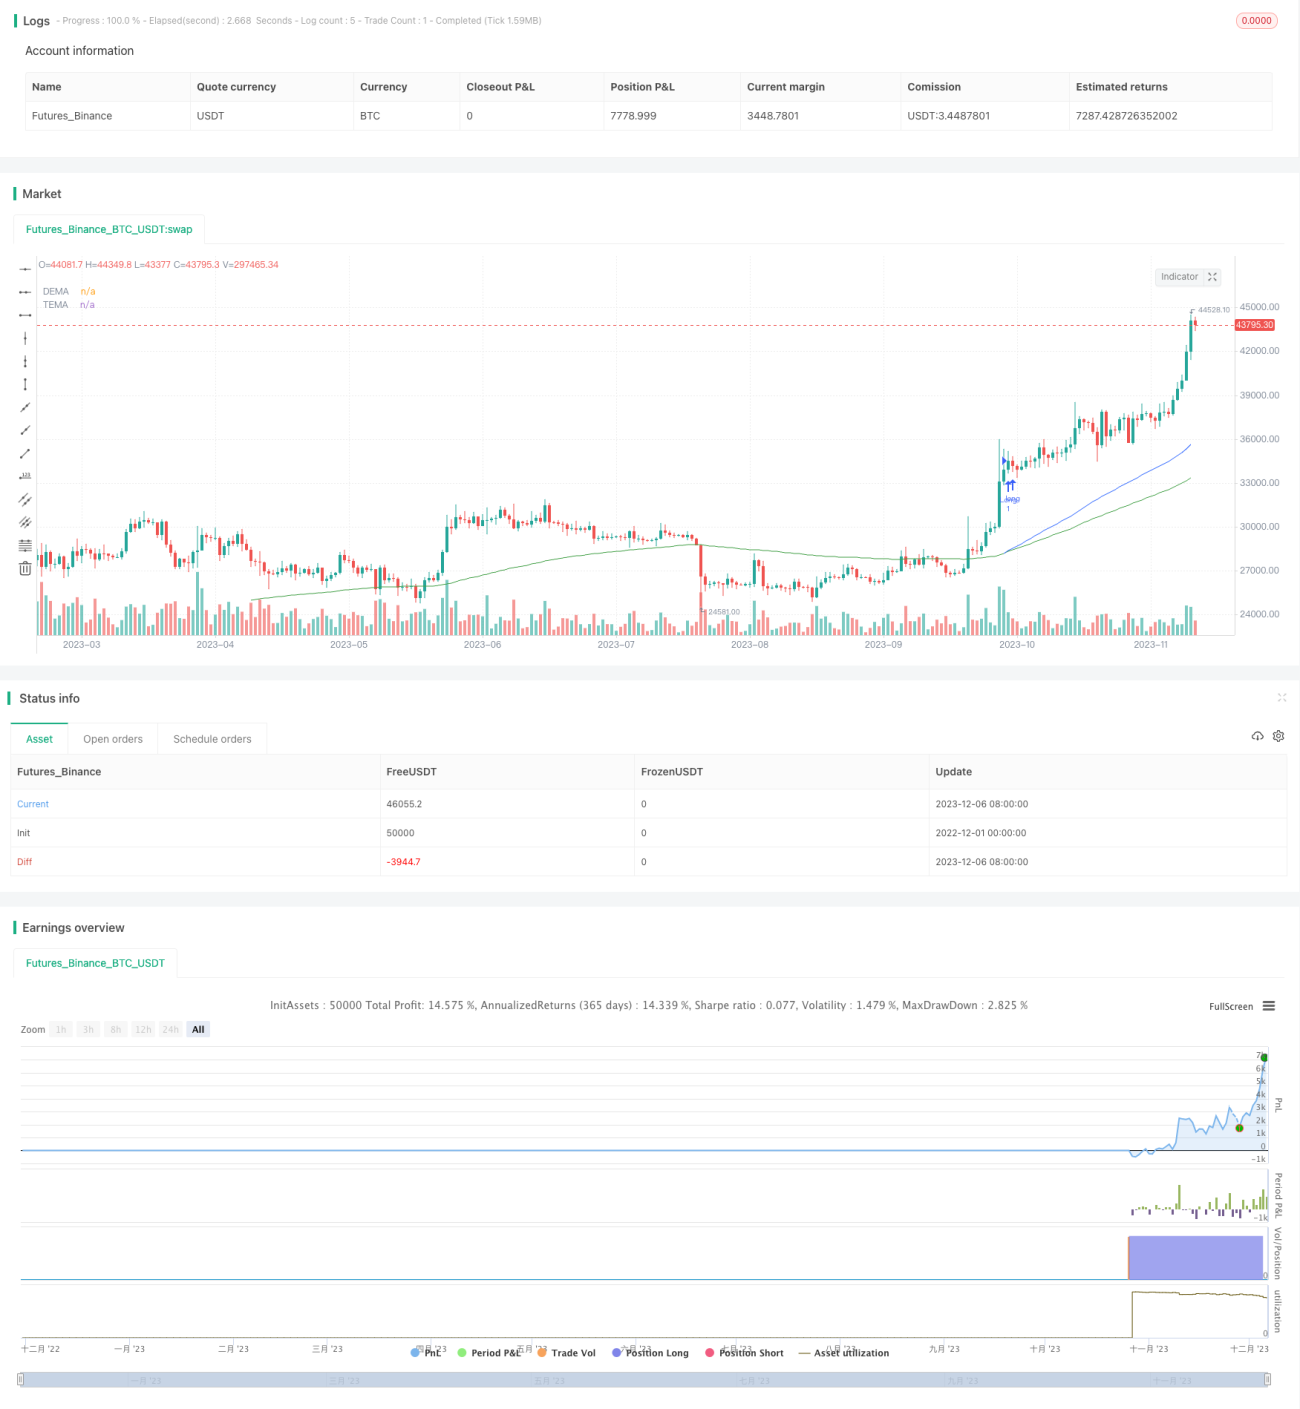
This strategy tracks the trend by calculating two dynamic moving averages, DEMA and TEMA, and establishing long or short positions when they generate golden crosses or death crosses. At the same time, the strategy sets a certain number of holding bars to avoid unnecessary stop loss.
Strategy Logic
The core logic of this strategy is to determine the trend direction based on the crossover between two dynamic moving averages, DEMA and TEMA.
DEMA stands for Double Exponential Moving Average. It combines the weighted smoothing feature of EMA and optimizes the lagging problem of EMA. Its formula is:
DEMA = 2*EMA(CLOSE, N) - EMA(EMA(CLOSE, N), N)
Here N is the Demalength.
TEMA stands for Triple Exponential Moving Average. It uses triple exponential smoothing to reduce the lagging of moving averages. Its formula is:
EMA1 = EMA(CLOSE, Temalength)
EMA2 = EMA(EMA1, Temalength)
EMA3 = EMA(EMA2, Temalength)
TEMA = 3EMA1 - 3EMA2 + EMA3
When TEMA crosses over DEMA, it is considered as a golden cross signal to go long. When TEMA crosses below DEMA, it is considered as a death cross signal to go short.
In addition, the strategy sets the delayBars to ensure the validity of signals and avoid false signals. It requires the golden/death cross to continue for a certain period before triggering entry.
Finally, the strategy adopts dual checking logic. It will check whether the opposite position needs to be closed before opening new trades. This avoids the risk of double direction positions.
Advantage Analysis
- More accurate trend judgment using two dynamic MAs
Compared to traditional EMA and SMA, DEMA and TEMA are more sensitive dynamic MAs that can quickly capture trend changes, thus improving the accuracy of market trend judgments.
- Filtering false signals by setting a delay period
The delayBars parameter forces the strategy to wait for a period of time after the signal emerges before entering positions. This filters out some false signals and avoids being trapped.
- Reducing risks through dual checking
By checking whether the opposite position needs to be closed before opening new trades, the strategy avoids holding double direction positions and minimizes losses from hedge trades.
- Strong universality
This strategy relies mainly on the crossover between MAs, a common technical indicator, to determine trends and signals. It does not rely on specific products and is suitable for most trending products.
Risk Analysis
- Prone to being trapped in whipsaw markets
In a market with huge sideways fluctuations, MAs may frequently cross and generate false signals that cause losses. In this case, the delay settings may fail too.
The solutions are to pause the strategy when identifying sideways trends, or properly adjust the MA parameters and delay periods.
- Fails to identify traps or black swan events
The strategy purely tracks price trends and cannot predict short-term traps or trend reversals caused by major events. It may lead to huge losses in such cases.
The solutions are to incorporate other indicators to assess risks, or properly reduce position sizes.
Optimization Directions
- Test more types of MAs
Apart from DEMA and TEMA, test combinations of SMA, EMA, and other enhanced MAs to find the most suitable ones for this market.
- Optimize MA parameters and delay periods
Run optimizations to find the optimum MA lengths and signal delay periods for more accurate trading signals.
- Adapt parameters for different products
Given different product characteristics, find suitable combinations of MA lengths, delay periods for their price fluctuations and trendiness.
- Incorporate other indicators for risk assessment
E.g. use Bollinger Bands to judge volatility and price level to avoid whipsaw markets. Use momentum indicators to evaluate trend strengths.
Conclusion
This is a basic trend following strategy based on dynamic MA crossovers between DEMA and TEMA. Its advantages are high stability, reliability and universality. But it also has some lagging and weak reversal detection capacity. This article provides a comprehensive analysis of its pros, cons and optimization directions, serving as valuable references for using this strategy. On the whole, it offers a typical example of quantitative trading strategy design worthy of further study.
- 1