Exponential Moving Average Bounce Strategy

Author: ChaoZhang, Date: 2023-12-08 16:47:39
Tags:

img

Strategy Overview

The exponential moving average (EMA) bounce strategy is a strategy that tracks price breakthroughs of the moving average line. It checks whether candles bounce back from below the moving average line. If so, it is a bullish signal; if the candle bounces down from above the moving average line, it is a bearish signal.

Strategy Name

Exponential Moving Average Bounce Strategy

Strategy Logic

This strategy is based on the exponential moving average (EMA) line. It calculates an EMA line in real time. Then it checks whether the price bounces back from the EMA line:

  • If the price first breaks through the EMA line and then rebounds back above the EMA line, it is a bullish signal
  • If the price first breaks through the EMA line and then falls back below the EMA line, it is a bearish signal

Such a rebound is the entry signal for the strategy.

Advantage Analysis

Trade with the trend, avoid being trapped

The EMA bounce strategy only enters after confirming the price reversal, which avoids trading against the trend and being trapped.

Small drawdowns, good historical returns

By using the exponential moving average, the strategy can effectively smooth the price data and filter out market noise, resulting in small drawdowns and good historical returns.

Easy to understand, flexible parameter adjustment

The EMA bounce strategy relies simply on moving averages, which is straightforward for beginners to understand. Meanwhile, the EMA period can be flexibly adjusted to adapt to different products.

Risk Analysis

Prone to false signals

There are often dense false breakouts around the EMA line, which may cause wrong signals. The EMA parameters need to be adjusted to filter out the noise.

Trading with the trend, unable to predict turning points

The strategy essentially trades along with the trend. It is unable to predict price turning points and can only follow the trend. This may miss the best entry opportunity during cyclic adjustments.

Stop loss prone to being taken out

The stop loss near the moving average line sometimes gets hit, leading to enlarged losses. This calls for more flexible stop loss methods.

Optimization

Incorporate other indicators for signal filtering

Indicators like RSI and MACD can be added to confirm the price reversal and filter out false signals.

Optimize stop loss methods

More flexible stop loss methods like time stops and volatility stops can be used to reduce the risk of being taken out.

Parameter optimization

Optimize the EMA period parameters to find the best parameter combinations. The EMA parameters can also be made dynamic to track market cycles.

Conclusion

The EMA bounce strategy is a simple and practical trend following strategy. It has small drawdowns and is easy to understand. At the same time, it also has some risks of false signals and being stopped out. We can optimize the strategy by using better indicator combinations, stop loss methods and parameter selections to make it a stable and reliable quantitative strategy.
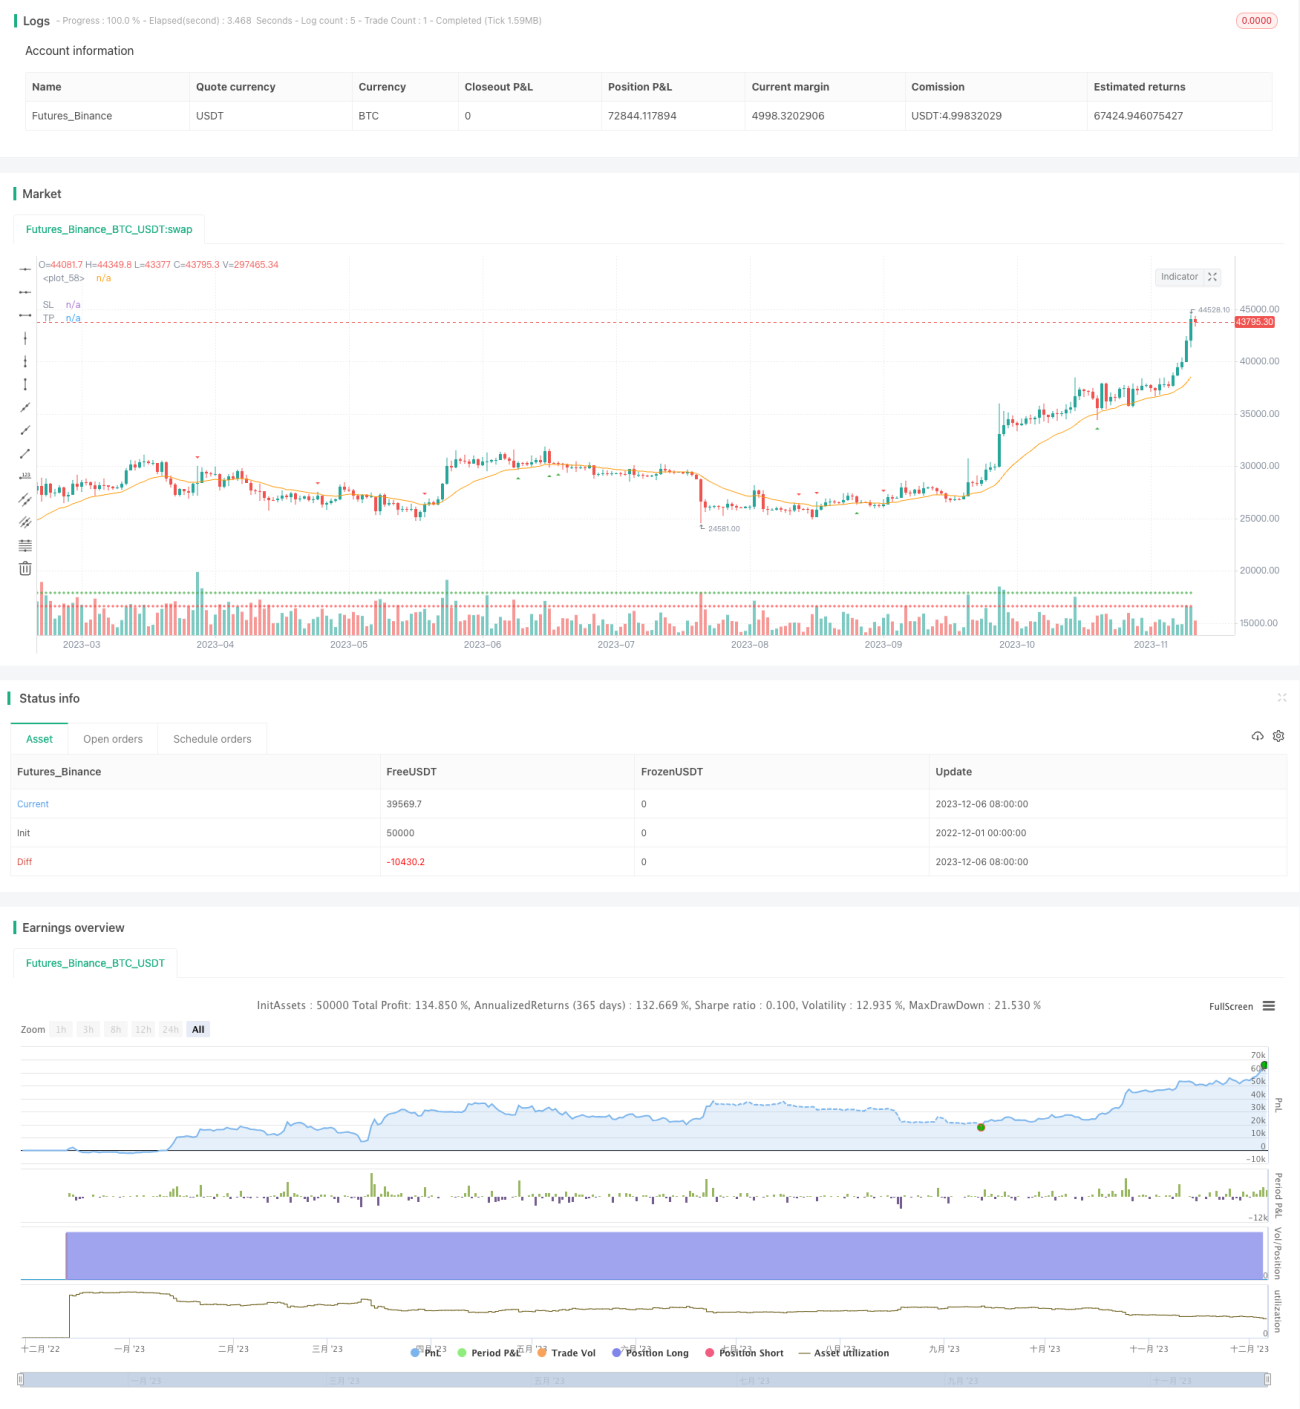

/*backtest
start: 2022-12-01 00:00:00
end: 2023-12-07 00:00:00
period: 1d
basePeriod: 1h
exchanges: [{"eid":"Futures_Binance","currency":"BTC_USDT"}]
*/

// This source code is subject to the terms of the Mozilla Public License 2.0 at https://mozilla.org/MPL/2.0/
// © tweakerID

// Simple strategy that checks for price bounces over an Exponential Moving Average. If the CLOSE of the candle bounces
// back from having it's LOW below the EMA, then it's a Bull Bounce. If the CLOSE of the candle bounces down from having it's
// high above the EMA, then it's a Bear Bounce. This logic can be reverted.

//@version=4
strategy("EMA Bounce", overlay=true, 
     default_qty_type=strategy.percent_of_equity, 
     default_qty_value=100, 
     initial_capital=10000, 
     commission_value=0.04, 
     calc_on_every_tick=false, 
     slippage=0)

direction = input(0, title = "Strategy Direction", type=input.integer, minval=-1, maxval=1)
strategy.risk.allow_entry_in(direction == 0 ? strategy.direction.all : (direction < 0 ? strategy.direction.short : strategy.direction.long))

/////////////////////// STRATEGY INPUTS ////////////////////////////////////////
title1=input(true, "-----------------Strategy Inputs-------------------")  

i_EMA=input(20, title="EMA Length")

/////////////////////// BACKTESTER /////////////////////////////////////////////
title2=input(true, "-----------------General Inputs-------------------")  

// Backtester General Inputs
i_SL=input(true, title="Use Swing Stop Loss and Take Profit")
i_SPL=input(defval=10, title="Swing Point Loopback")
i_PercIncrement=input(defval=.2, step=.1, title="Swing Point SL Perc Increment")*0.01
i_TPRRR = input(1.2, step=.1, title="Take Profit Risk Reward Ratio")

// Bought and Sold Boolean Signal
bought = strategy.position_size > strategy.position_size[1] 
 or strategy.position_size < strategy.position_size[1]

// Price Action Stop and Take Profit
LL=(lowest(i_SPL))*(1-i_PercIncrement)
HH=(highest(i_SPL))*(1+i_PercIncrement)
LL_price = valuewhen(bought, LL, 0)
HH_price = valuewhen(bought, HH, 0)
entry_LL_price = strategy.position_size > 0 ? LL_price : na 
entry_HH_price = strategy.position_size < 0 ? HH_price : na 
tp=strategy.position_avg_price + (strategy.position_avg_price - entry_LL_price)*i_TPRRR
stp=strategy.position_avg_price - (entry_HH_price - strategy.position_avg_price)*i_TPRRR


/////////////////////// STRATEGY LOGIC /////////////////////////////////////////

EMA=ema(close, i_EMA)
LowAboveEMA=low > EMA
LowBelowEMA=low < EMA
HighAboveEMA=high > EMA
HighBelowEMA=high < EMA
BullBounce=LowAboveEMA[1] and LowBelowEMA and close > EMA //and close > open
BearBounce=HighBelowEMA[1] and HighAboveEMA and close < EMA //and close < open
plot(EMA)

BUY=BullBounce
SELL=BearBounce

//Inputs
DPR=input(false, "Allow Direct Position Reverse")
reverse=input(false, "Reverse Trades")

// Entries
if reverse
    if not DPR
        strategy.entry("long", strategy.long, when=SELL and strategy.position_size == 0)
        strategy.entry("short", strategy.short, when=BUY and strategy.position_size == 0)
    else     
        strategy.entry("long", strategy.long, when=SELL)
        strategy.entry("short", strategy.short, when=BUY)
else
    if not DPR 
        strategy.entry("long", strategy.long, when=BUY and strategy.position_size == 0)
        strategy.entry("short", strategy.short, when=SELL and strategy.position_size == 0)
    else
        strategy.entry("long", strategy.long, when=BUY)
        strategy.entry("short", strategy.short, when=SELL)


SL=entry_LL_price
SSL=entry_HH_price
TP=tp
STP=stp

strategy.exit("TP & SL", "long", limit=TP, stop=SL, when=i_SL)
strategy.exit("TP & SL", "short", limit=STP, stop=SSL, when=i_SL)

/////////////////////// PLOTS //////////////////////////////////////////////////

plot(strategy.position_size > 0 ? SL : na , title='SL', style=plot.style_cross, color=color.red)
plot(strategy.position_size < 0 ? SSL : na , title='SSL', style=plot.style_cross, color=color.red)
plot(strategy.position_size > 0 ? TP : na, title='TP', style=plot.style_cross, color=color.green)
plot(strategy.position_size < 0 ? STP : na, title='STP', style=plot.style_cross, color=color.green)
// Draw price action setup arrows
plotshape(BUY ? 1 : na, style=shape.triangleup, location=location.belowbar, 
 color=color.green, title="Bullish Setup", transp=80, size=size.auto)
plotshape(SELL ? 1 : na, style=shape.triangledown, location=location.abovebar, 
 color=color.red, title="Bearish Setup", transp=80, size=size.auto)


More