Bollinger Percentage Bands Trading Strategy

Overview
This strategy is based on the Bollinger Bands indicator, combined with moving averages and the ATR technical indicator, to implement a short-term breakout system. The strategy calculates the relative percentage position of prices within the Bollinger Bands channel to judge overbought and oversold situations, combined with new highs and lows breakouts to generate trading signals.
Strategy Logic
- Calculate Bollinger Bands channel and the relative percentage position of prices within the channel
- Calculate moving averages separately for open, close, high and low prices
- Calculate ATR indicator and set stop loss lines combined with ATR
- Judge whether prices are near new highs or new lows
- Combine yearly highs and lows to judge bigger timeframe trends
- Generate trading signals based on changes in Bollinger Bands percentage and new highs/lows
This strategy uses Bollinger Bands channel to judge market volatility, with channel width determined by standard deviation. Buy signals are generated when prices break below the lower band, and sell signals when prices break above the upper band. Moving averages can smooth out Bollinger fluctuations and reduce false breakouts. ATR indicator combines with trailing stop loss to fix stop loss scale. New highs/lows help avoid chasing tops and limit downside. Yearly highs/lows filter out bigger timeframe consolidation. In summary, this strategy combines various technical analysis tools to judge market rhythm and entry timing.
Advantages
- Strict Bollinger Bands breakout filters help reduce false signals
- Moving averages smooth prices and identify true trends
- ATR indicator dynamically trails stop loss and limits single trade loss
- New highs/lows and yearly highs/lows make signals more reliable
- Effective combination of multiple indicators improves efficiency
Risks and Solutions
- Improper Bollinger Bands parameters may cause excessive false breakouts, different parameter combinations should be tested for best results
- Closing price reference may lead to drawdowns exceeding ATR-set stop loss range, consider using more volatile high/low prices for percentage calculation
- Strict Bollinger filtering may miss some longer-term trend opportunities, appropriately relax filters and holding period
- ATR indicator trails large price swings slowly, consider higher frequency volatility measures like true range
- New highs/lows breakouts are easily disturbed by short-term noise, evaluate statistical significance and trend sustainability
Optimization Directions
- Test different parameter combinations to determine optimal Bollinger parameters and moving average lengths
- Employ model combination incorporating different Bollinger parameters or moving averages
- Test robustness across different timeframes and products, improve adaptiveness
- Incorporate more higher timeframe signals like daily Bollinger signals or seasonal factors
- Evaluate trend-following opportunities to expand strategy coverage and profitability
Conclusion
This strategy effectively combines Bollinger percentage bands, moving averages, ATR indicator, new highs/lows and yearly highs/lows to construct a relatively strict and efficient short-term breakout trading system. Its outstanding advantage lies in using various tools to reduce noise and identify true trend signals. Of course the strategy also faces some parameter tuning difficulties and missed opportunities under strict conditions. Overall it represents a unique trading style and high-efficiency Bollinger breakout strategy that warrants further research and validation on real trading data.
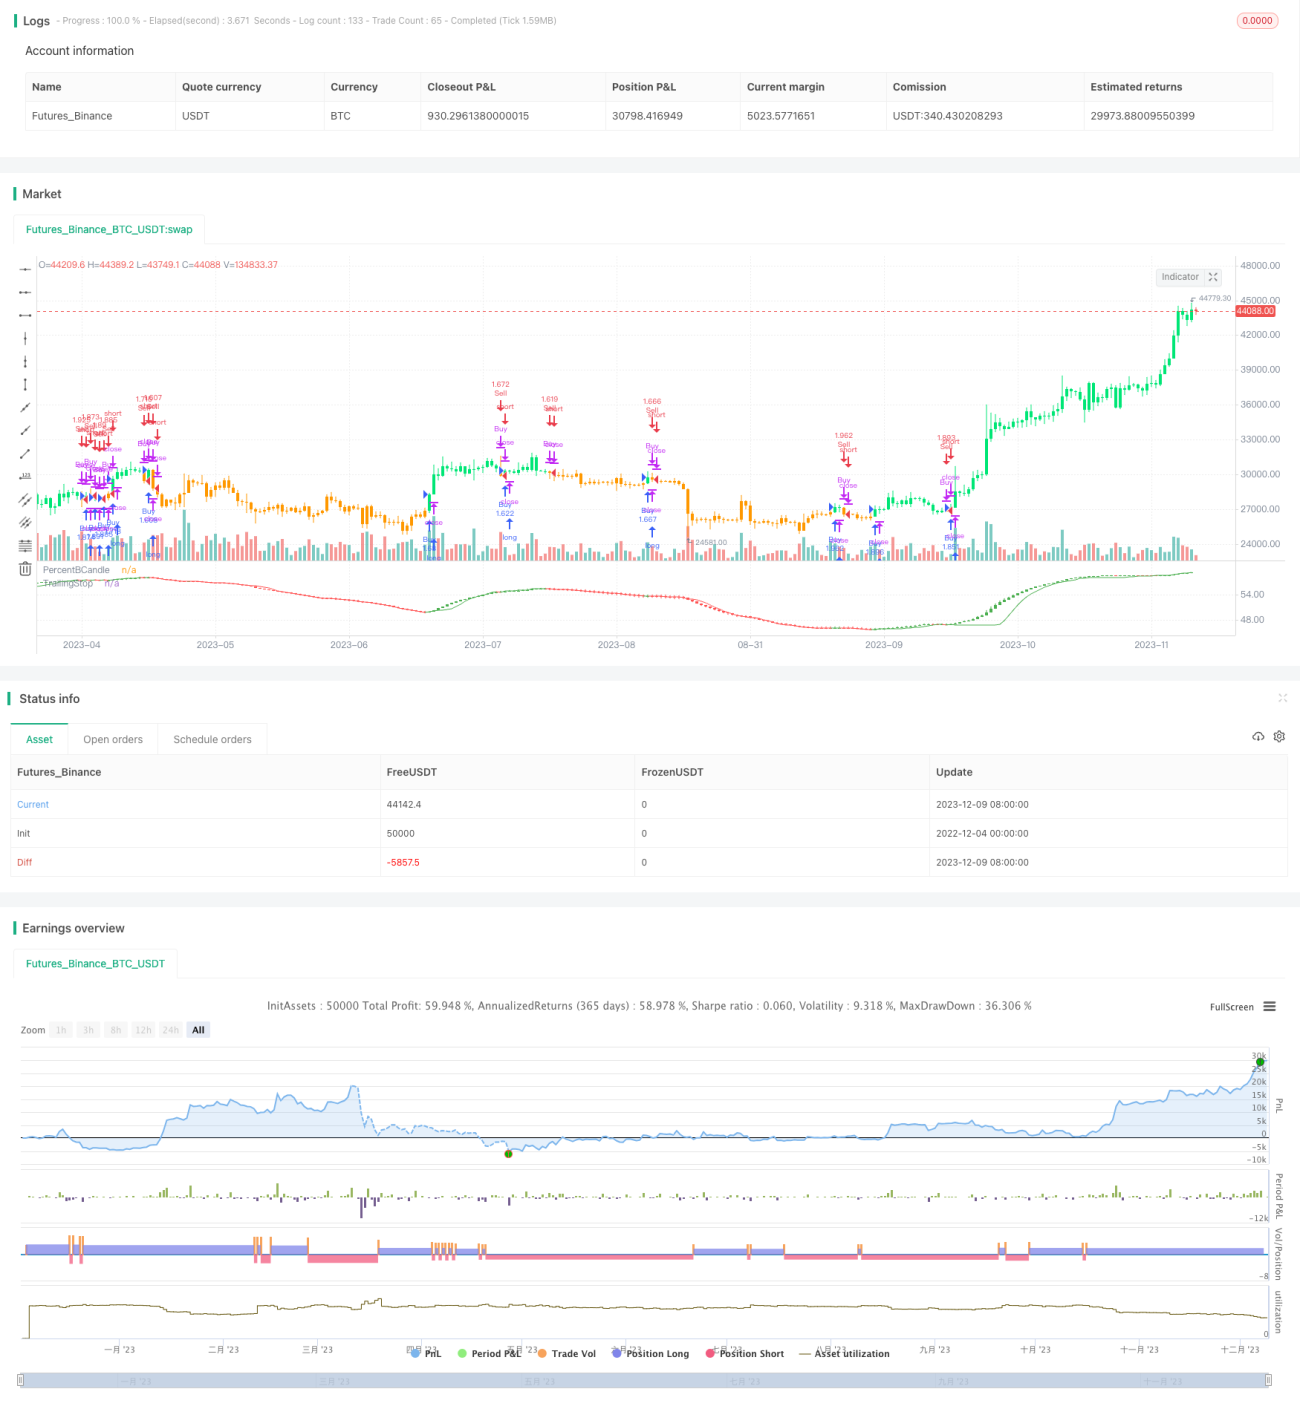
/*backtest
start: 2022-12-04 00:00:00
end: 2023-12-10 00:00:00
period: 1d
basePeriod: 1h
exchanges: [{"eid":"Futures_Binance","currency":"BTC_USDT"}]
*/

// This source code is subject to the terms of the Mozilla Public License 2.0 at https://mozilla.org/MPL/2.0/
// © HeWhoMustNotBeNamed

//@version=4- 1