Golden Cross Moving Average Trading Strategy

Overview
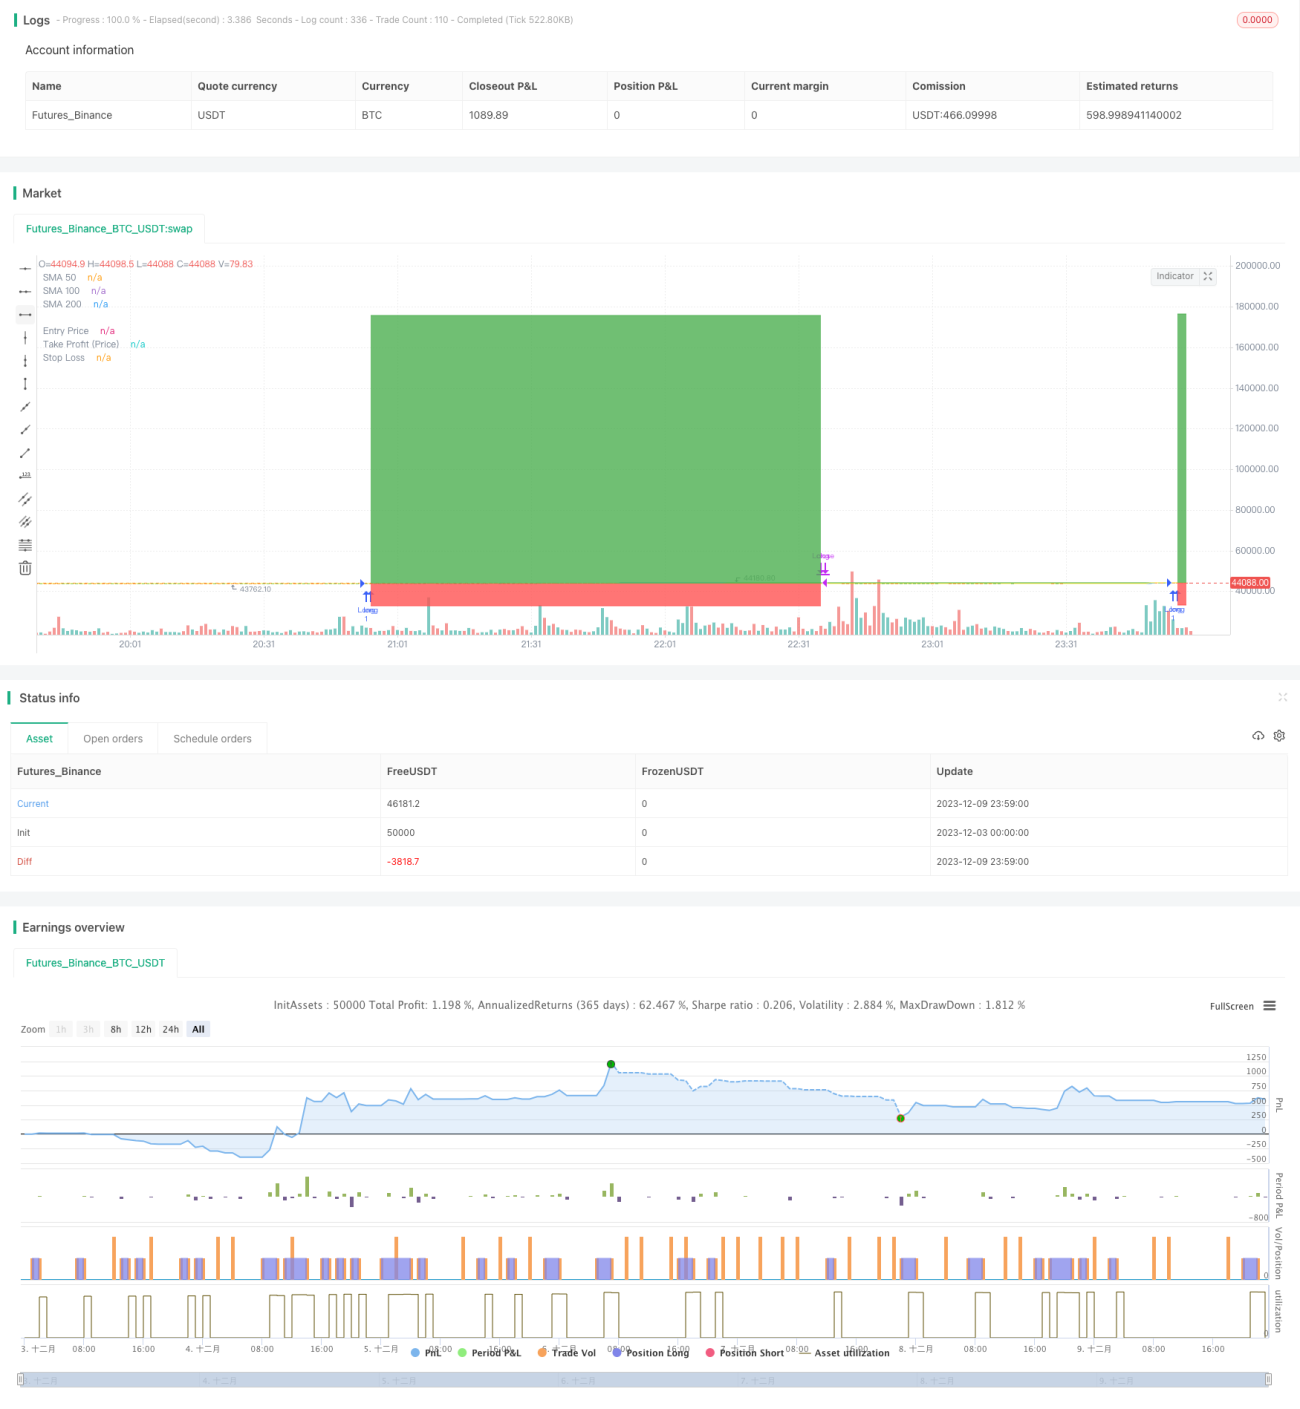
The Golden Cross Moving Average Trading Strategy is a classic quantitative trading strategy. This strategy uses moving averages of different periods to determine market trends for long and short positions. When the short-term moving average crosses above the longer-term moving average, it is considered a buy signal. When the short-term moving average crosses below the long-term moving average, it is considered a sell signal.
Strategy Logic
This strategy is based on three simple moving averages (SMA) of different periods: 50-day, 100-day and 200-day. The specific trading logic is as follows:
-
Entry signal: when the 50-day moving average crosses above the 100-day moving average, go long.
-
Exit signal: when the 50-day moving average crosses below the 100-day moving average, close positions; or when the close price is below the 100-day moving average, exit; or when the 100-day moving average crosses below the 200-day moving average, exit.
-
Take profit and stop loss: set trailing take profit and fixed stop loss.
This strategy utilizes the ability of moving averages to effectively determine market average price trends. The crossover of short-term and long-term averages is viewed as the market entering an upward or downward trend, hence the long or exit signals. This allows the strategy to effectively capture market trends.
Advantages
-
Simple to implement. It only requires three moving averages of different periods.
-
Highly stable. Moving averages have noise filtering abilities that reduce the impact of market randomness on trades and make signals more reliable.
-
Easy to capture major trends. Moving averages effectively reflect changes in the average market price trend, using crossovers between short and long-term lines to determine major trend changes.
-
Highly customizable. The moving average periods can be adjusted for different levels of risk control.
Risks
-
May generate many false signals. Frequent crossovers can happen when the short and long-term averages are too close, resulting in excessive invalid signals.
-
Slow to respond to sudden events. Moving averages respond to price changes slowly and cannot instantly react to market news and major events.
-
Unable to profit from minor fluctuations. The noise filtering also means missing out on profits from minor market swings.
-
Subjective parameter selection. The appropriate moving average periods are largely subjective and dependent on the specific market.
Enhancement Opportunities
-
Add filters to reduce false signals, such as price range filters to limit signals to movements above a certain magnitude.
-
Incorporate other indicators for combinational strategies, which can improve signal accuracy, e.g. volatility or volume indicators.
-
Add adaptive optimization modules to dynamically optimize moving average periods based on machine learning algorithms, enabling adaptation to evolving market conditions.
-
Incorporate advanced deep learning models instead of moving averages for superior feature extraction and modeling capabilities.
Conclusion
The Golden Cross Moving Average Trading Strategy is a typical trend following strategy. It reflects average market price trends simply and practically, suitable for beginners. However, it also has some flaws that can be improved through enhancing signal quality, combining with other technical indicators, introducing adaptive mechanisms, etc to adapt to more complex markets. Overall, this is a strategy with high reference and learning value.
- 1