概述
本策略是基于ATR指标设计的动态追踪止损机制,可以在保证止损的同时,实时调整止损位置,争取更大盈利。
策略原理
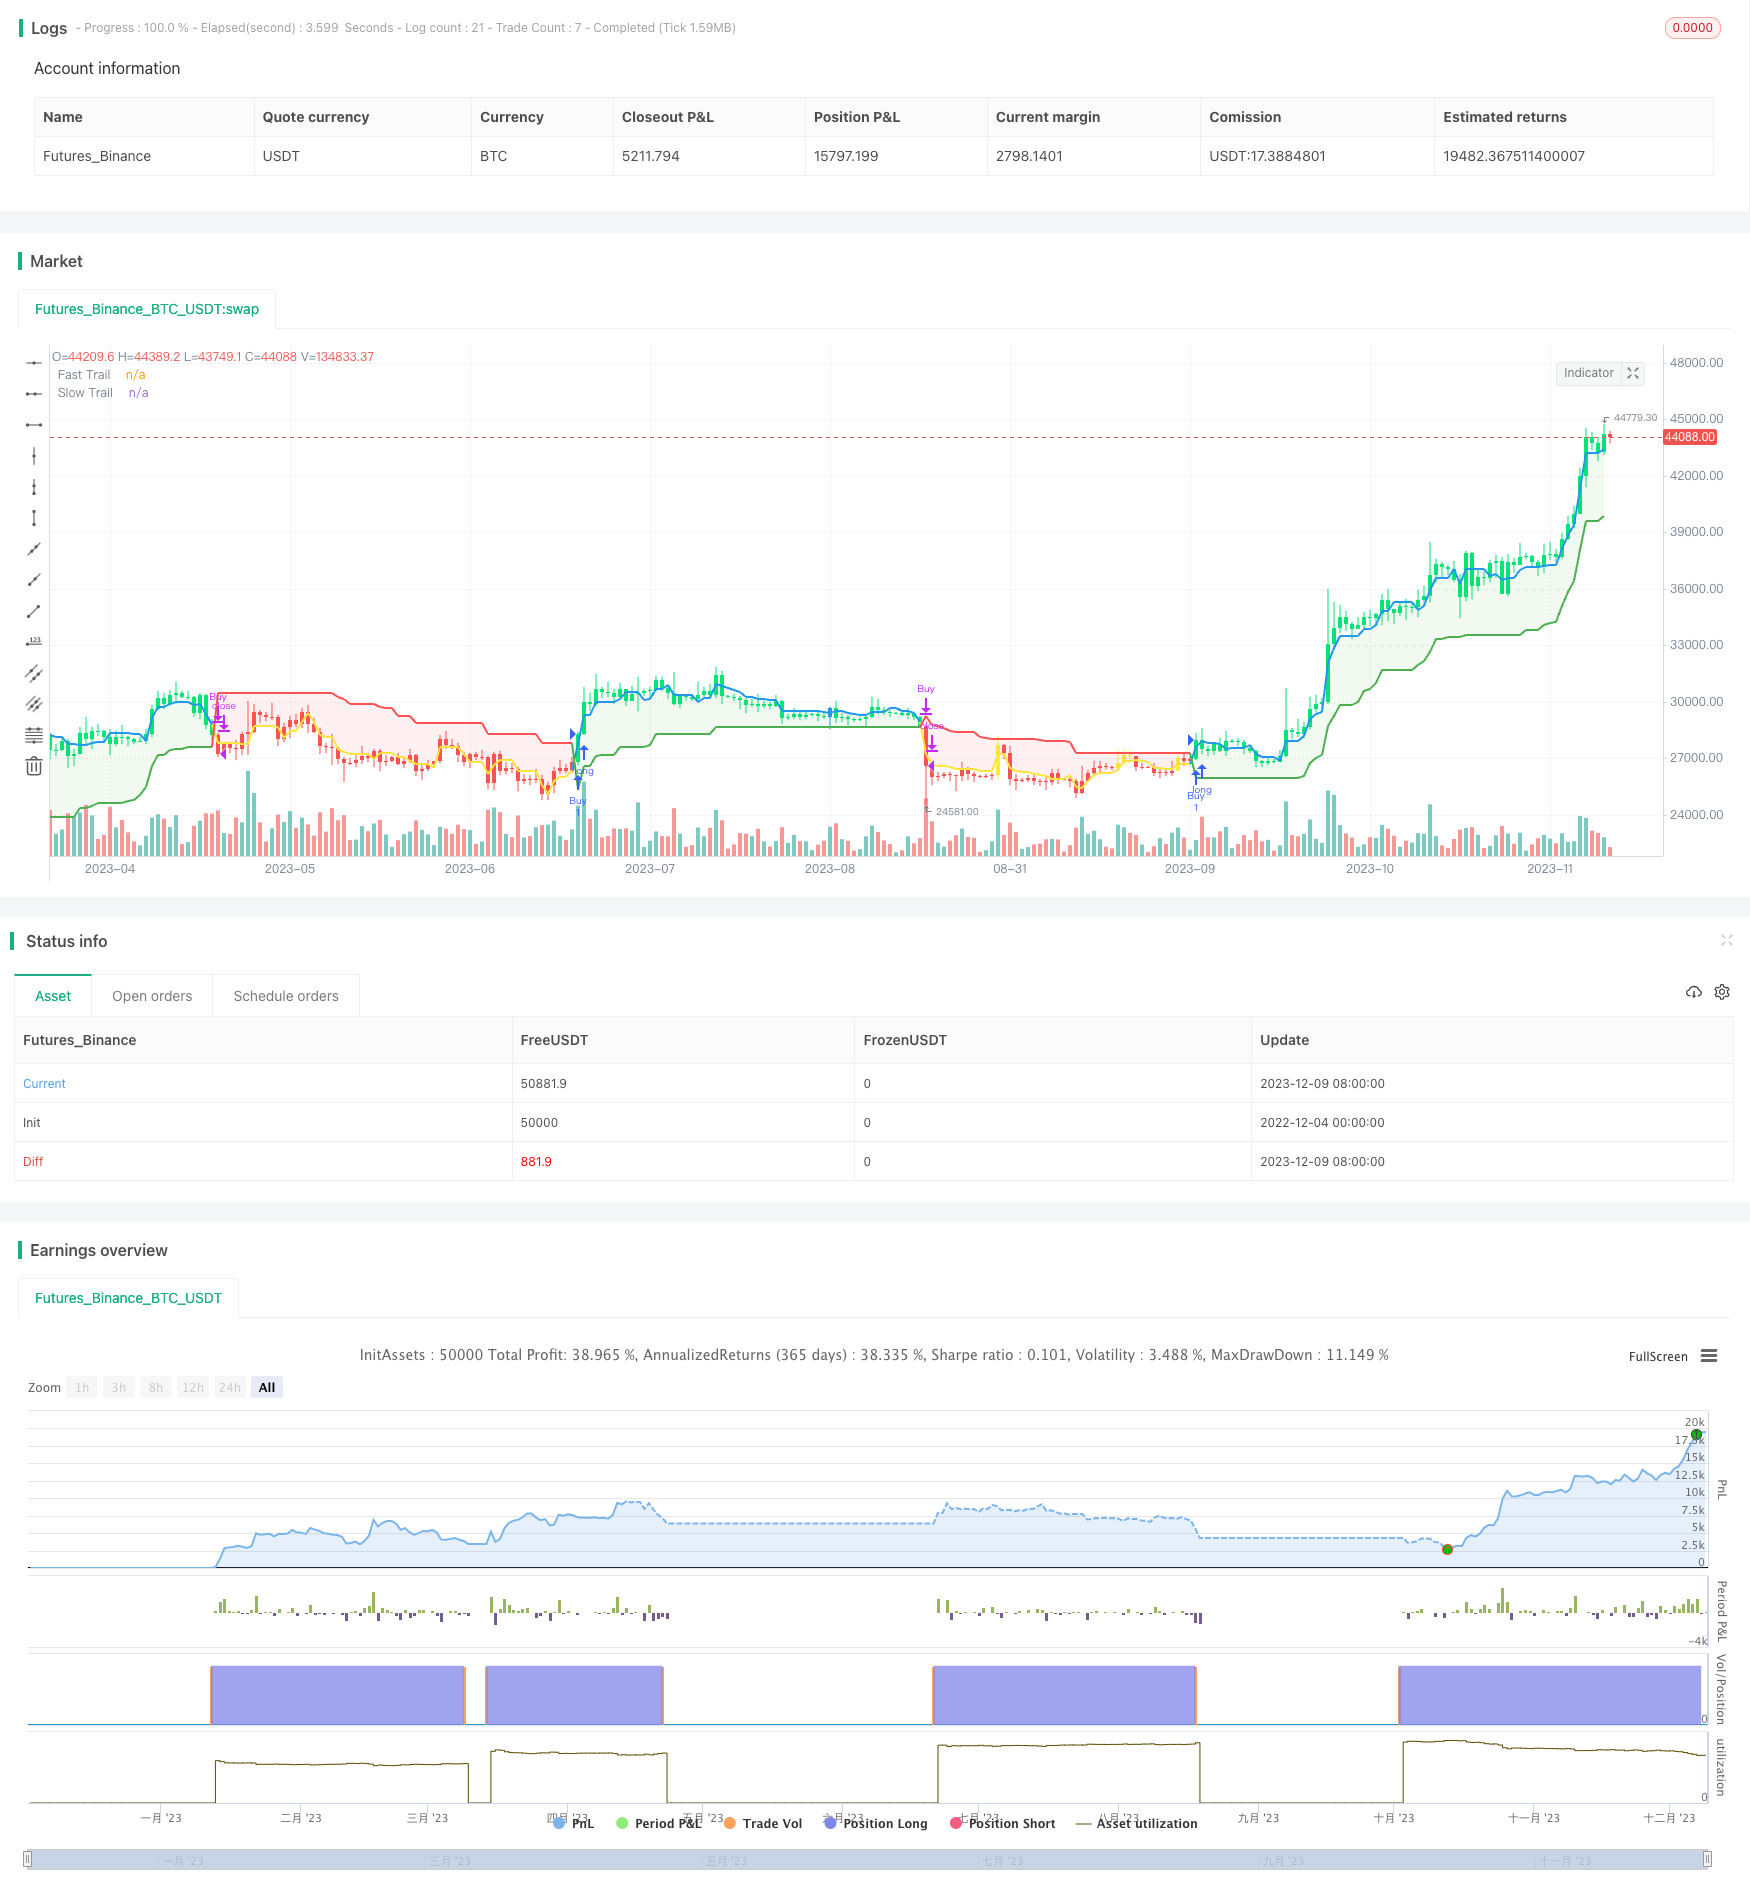
策略使用快速ATR周期5和慢速ATR周期10构建双层动态追踪止损。当价格运行向有利方向时,快速层会第一时间启动追踪,收紧止损位置;当价格短期回调时,慢速层的止损位置可以避免过早止损。同时,快慢速层之间的交叉作为交易信号。
具体来说,快速层的止损距离为0.5倍5周期ATR,慢速层的止损距离为3倍10周期ATR。当快速层向上突破慢速层时产生买入信号;当快速层向下跌破慢速层时产生卖出信号。止损线也会实时更新,并画在价格曲线之下。
优势分析
该策略最大的优势是可以动态调整止损位置,在保证止损的前提下,最大限度争取更多盈利。相比固定止损距离,动态ATR止损线可以根据市场波动程度作出调整,降低止损被激活的概率。
此外,双层ATR设计可以平衡止损的灵敏度。快速层响应迅速,慢速层则可以过滤掉短期噪音,避免过早止损。
风险分析
该策略主要的风险在于止损距离设定是否合理。如果ATR倍数设置过大,止损幅度将跟不上价格运行。如果ATR倍数过小,则容易被短期噪音止损。所以需要根据不同品种的特点调整参数。
此外,在盘整行情中,ATR值较小,止损线靠得较近,容易被频繁止损。所以该策略更适合具有一定波动率的品种。
优化方向
可以尝试不同的ATR周期参数组合,寻找最佳平衡。此外可以考虑和其他指标配合使用,例如趋势指标判断市场阶段,从而动态调整ATR倍数的大小。
也可以研究替代ATR指标的可能性。将ATR改为DKVOL、HRANGE或ATR百分比等指标值,可能可以获得更好的止损效果。
总结
本策略基于ATR指标设计了双层动态追踪机制,既可争取更大盈利,有可避免过度止损。适合对止损要求较高的用户。该策略可根据市场和品种特点灵活调整参数,从而达到最佳止损效果。
策略源码
/*backtest
start: 2022-12-04 00:00:00
end: 2023-12-10 00:00:00
period: 1d
basePeriod: 1h
exchanges: [{"eid":"Futures_Binance","currency":"BTC_USDT"}]
*/

//@version=4
strategy("ATR Trailing Stop Strategy by ceyhun", overlay=true)

/////////notes////////////////////////////////////////
// This is based on the ATR trailing stop indicator //
// width addition of two levels of stops and        //
// different interpretation.                        //
// This is a fast-reacting system and is better     //
// suited for higher volatility markets             //
//////////////////////////////////////////////////////

SC = input(close, "Source", input.source)

// Fast Trail //
AP1 = input(5, "Fast ATR period", input.integer)  // ATR Period
AF1 = input(0.5, "Fast ATR multiplier", input.float)  // ATR Factor
SL1 = AF1 * atr(AP1)  // Stop Loss
Trail1 = 0.0
Trail1 := iff(SC > nz(Trail1[1], 0) and SC[1] > nz(Trail1[1], 0), max(nz(Trail1[1], 0), SC - SL1), iff(SC < nz(Trail1[1], 0) and SC[1] < nz(Trail1[1], 0), min(nz(Trail1[1], 0), SC + SL1), iff(SC > nz(Trail1[1], 0), SC - SL1, SC + SL1)))

// Slow Trail //
AP2 = input(10, "Slow ATR period", input.integer)  // ATR Period
AF2 = input(3, "Slow ATR multiplier", input.float)  // ATR Factor
SL2 = AF2 * atr(AP2)  // Stop Loss
Trail2 = 0.0
Trail2 := iff(SC > nz(Trail2[1], 0) and SC[1] > nz(Trail2[1], 0), max(nz(Trail2[1], 0), SC - SL2), iff(SC < nz(Trail2[1], 0) and SC[1] < nz(Trail2[1], 0), min(nz(Trail2[1], 0), SC + SL2), iff(SC > nz(Trail2[1], 0), SC - SL2, SC + SL2)))

// Bar color for trade signal //
Green = Trail1 > Trail2 and close > Trail2 and low > Trail2
Blue = Trail1 > Trail2 and close > Trail2 and low < Trail2
Red = Trail2 > Trail1 and close < Trail2 and high < Trail2
Yellow = Trail2 > Trail1 and close < Trail2 and high > Trail2

// Signals //
Bull = barssince(Green) < barssince(Red)

Buy = crossover(Trail1, Trail2)
Sell = crossunder(Trail1, Trail2)

TS1 = plot(Trail1, "Fast Trail", style=plot.style_line, color=Trail1 > Trail2 ? color.blue : color.yellow, linewidth=2, display=display.none)
TS2 = plot(Trail2, "Slow Trail", style=plot.style_line, color=Trail1 > Trail2 ? color.green : color.red, linewidth=2)
fill(TS1, TS2, Bull ? color.new(color.green, 90) : color.new(color.red, 90))

plotcolor = input(true, "Paint color on chart", input.bool)

bcl = iff(plotcolor == 1, Blue ? color.blue : Green ? color.lime : Yellow ? color.yellow : Red ? color.red : color.white, na)
barcolor(bcl)

if Buy
    strategy.entry("Buy", strategy.long, comment="Buy")

if Sell
    strategy.close("Buy")