Inside Bar Range Breakout Strategy

Overview
The inside bar range breakout strategy is a price action strategy that makes trading decisions based on inside bar patterns. It occurs when the range of the current bar, measured by the difference between high and low, is smaller than that of the previous bar, indicating consolidation or indecision in the market. A breakout above or below the previous bar's high or low provides a potential entry signal in the direction of the breakout.
Strategy Logic
The strategy utilizes the following indicators and variables:
- Average True Range (ATR): The average true range over the past N bars calculated using the ATR function.
- Range: The difference between high and low of the current bar.
- insideBar: A boolean variable that is true if Range of current bar is smaller than previous bar, indicating an inside bar.
- breakoutUp: A boolean variable that is true if close is higher than previous bar's high, indicating an upward breakout.
- breakoutDown: A boolean variable that is true if close is lower than previous bar's low, indicating a downward breakout.
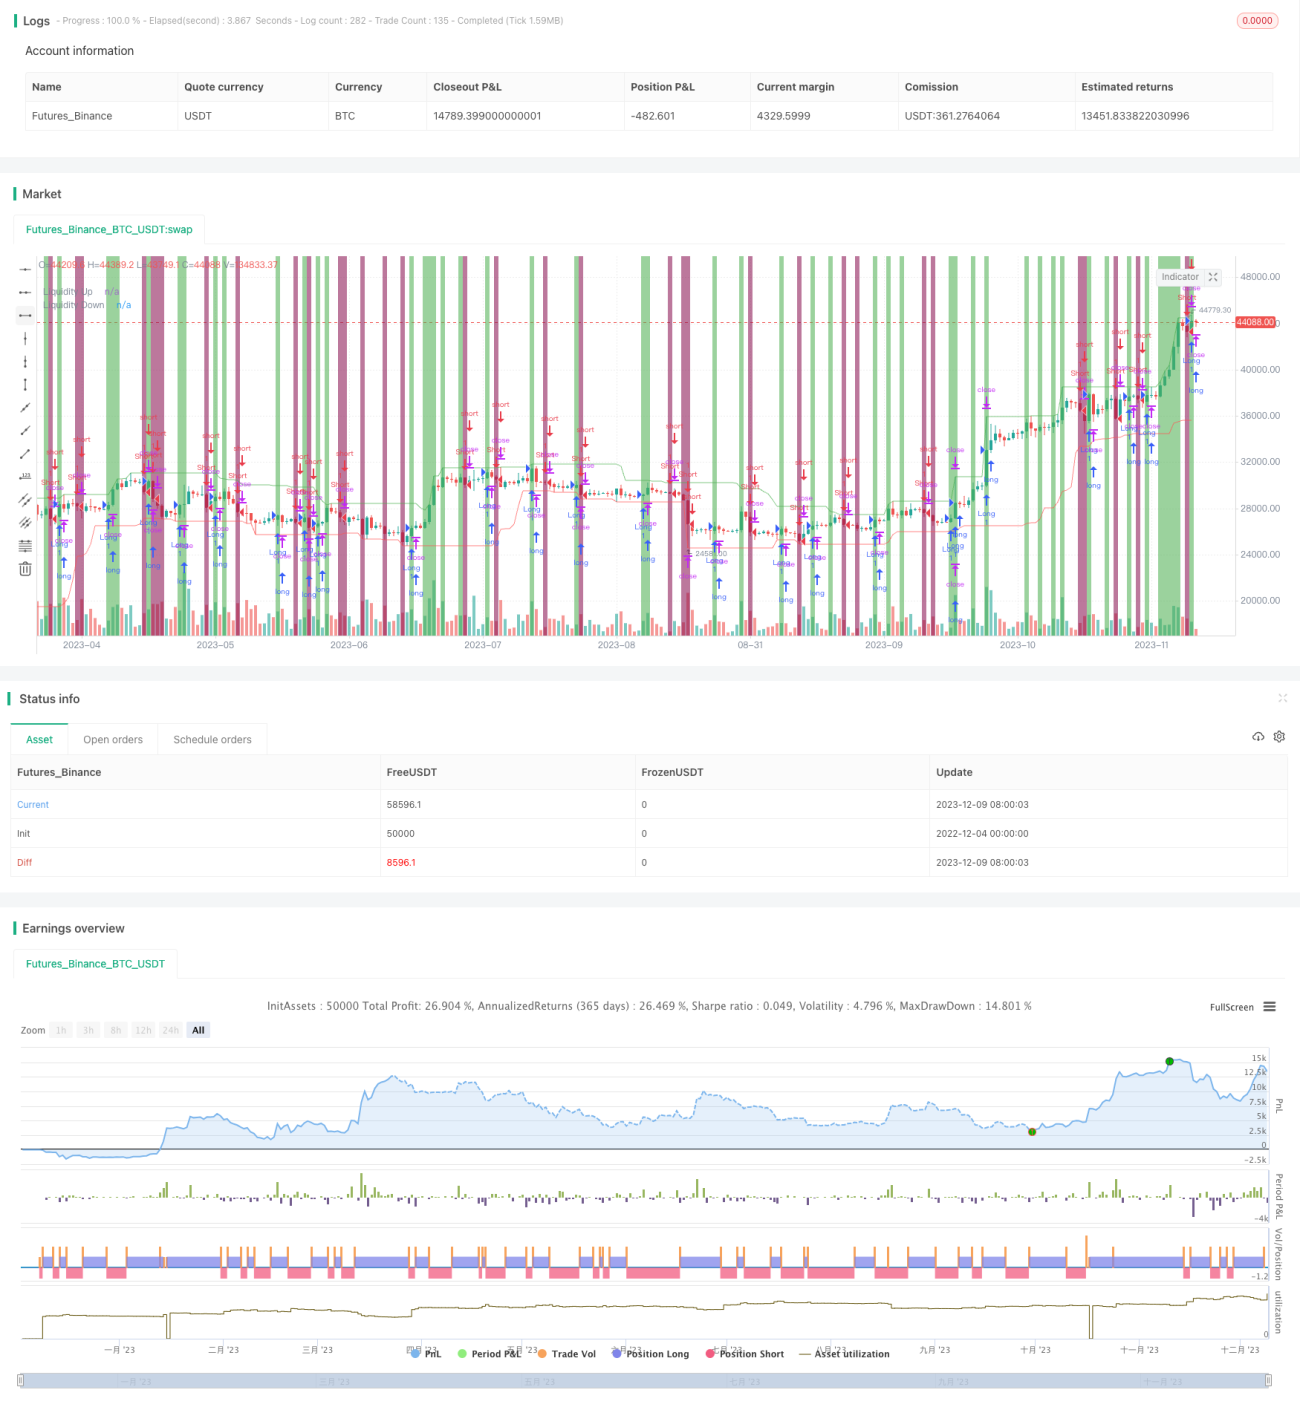
- liquidityUp: Highest high over past N bars, representing a potential resistance area.
- liquidityDown: Lowest low over past N bars, representing a potential support area.
Entry decisions are based on Range breakouts beyond previous bar's high/low. Specifically, long entry when upward breakout happens and current low is above liquidityDown, and short entry when downward breakout happens and current high is below liquidityUp.
Stop loss uses ATR multiplied by Range. Take profit uses ATR multiplied by Range.
Advantage Analysis
The advantages of this strategy include:
- Captures trading opportunity from range expansion after inside bar consolidation.
- Prevents getting trapped combining breakout direction and liquidity levels.
- Clear stop loss and take profit rules, easy to implement.
- Strong directionality, high chance of reaching profit target after momentum breakout.
Risk Analysis
Risks of this strategy:
- Failed breakout resulting in getting trapped. Use reasonable stop loss to limit loss amount.
- Volatile market causing stop loss being hit. Adjust ATR period to ensure proper stop distance.
- Inaccurate liquidity level leading to wrong entry. Optimize lookback period to refine entry criteria.
- Failed reversal unable to reach profit target. Reduce take profit multiplier for sensible target.
Optimization Directions
Areas of optimization:
- Find optimum ATR period for maximum performance.
- Test different stop loss multipliers for ideal stop distance.
- Test different take profit multipliers to balance size and probability.
- Optimize lookback period for better accuracy on liquidity levels.
- Add filters like volume to improve entry timing.
- Incorporate trend indicators to add trend following.
Summary
The inside bar range breakout strategy capitalizes on range expansion from consolidation by entering when price breaks out of previous bar's range. Liquidity levels avoid getting trapped. Reasonable stop loss and take profit settings allow riding the momentum after breakout to reach profit target. The strategy can yield good results on intermediate time frames. Further enhancing advantages and system robustness can be achieved through parameter optimization and improving entry filters.
- 1