Look-Up and Look-Down Strategy Based on Internal Price Channels

Author: ChaoZhang, Date: 2023-12-11 15:56:28
Tags:

img

Overview

This strategy utilizes internal price channels to determine future price trends and belongs to trend following strategies. When prices form a certain number of internal price fluctuation channels, it is judged as a trend reversal signal to make long or short entries. It also incorporates moving average filtering and stop-loss/take-profit to lock in profits and is a relatively common quantitative trading strategy.

Strategy Principle

The strategy determines the formation of internal channels according to the size relationship between the highest and lowest prices of the previous two candlesticks. When a certain number of candlesticks meet the condition that the highest price is lower than the highest price of the previous candlestick and the lowest price is higher than the lowest price of the previous candlestick, an internal price channel is identified.

When an internal channel is identified, the strategy also judges the direction of the channel. If it is a bullish internal channel, a long entry signal is generated. If it is a bearish internal channel, a short entry signal is generated. Therefore, this is a bidirectional trading strategy.

To filter false signals, a moving average indicator is also introduced. Actual trading signals are only generated when the price is above or below the moving average line. This can avoid erroneous trades to some extent in sideways markets.

After entry, stop-loss and take-profit points can also be set according to user’s choice. There are three available stop loss methods: fixed-point stop loss, ATR stop loss, previous highest/lowest stop loss. The take profit is set according to risk/reward ratio. This can lock in profits to some extent and control risks.

Advantage Analysis

The biggest advantage of this strategy is its strong ability to identify trend reversal points. When prices form a certain number of internal channels, it often signals that a relatively large price up/down movement is about to occur. This judgment is highly consistent with traditional technical analysis theories.

In addition, the configurability of the strategy itself is very strong. Users can freely select parameters such as the number of internal channels, moving average cycle, stop loss/take profit method, etc. This provides great flexibility for different products and trading styles.

Finally, the moving average filter and stop-loss/take-profit settings introduced in the strategy also greatly reduce trading risks. Making the strategy adaptable to trading in various market environments.

Risk Analysis

The biggest risk of this strategy is the relatively high probability of incorrect trend judgments. Internal channels cannot completely determine price reversals, there is a certain probability of misjudgment. If the determined quantity is insufficient, false signals may occur.

In addition, the strategy is completely useless in sideways or volatile markets. When prices fluctuate up and down without establishing a trend, the strategy will continuously generate incorrect signals. This is determined by the mechanism of the strategy.

Finally, if the stop loss is set too conservatively, the strategy may not be able to hold positions long enough to capture profits in major trends. This requires users to balance by themselves.

Optimization Directions

The optimization space of this strategy is still quite large. Some possible optimization directions include:

  1. Optimize the quantity and patterns of internal channels. Test trading effects under different quantities or different combination arrangements.

  2. Optimize the cycle parameter of the moving average to better determine the trend direction. The current default cycle may not be suitable for all products.

  3. Add other indicator filters. For example, introduce Bollinger Bands and only generate trading signals when prices break through the upper or lower rails of the Bands.

  4. Optimize stop loss/take profit parameters to allow the strategy to hold positions for longer. Thereby capturing profits in super trends.

In general, the existence of this strategy lies in the accuracy of its trend judgment. As long as the accuracy of the judgment can be ensured, combined with appropriate risk management settings, effective algorithmic trading can be carried out.

Conclusion

In summary, this strategy is a quantitative trading strategy that determines future price trends based on internal price channels. It combines trend following and trend reversal judgment methods and has certain advantages. But there is also room for optimization to meet specific products and trading environments. After parameter optimization, it can become one of the most ideal quantitative trading strategies.
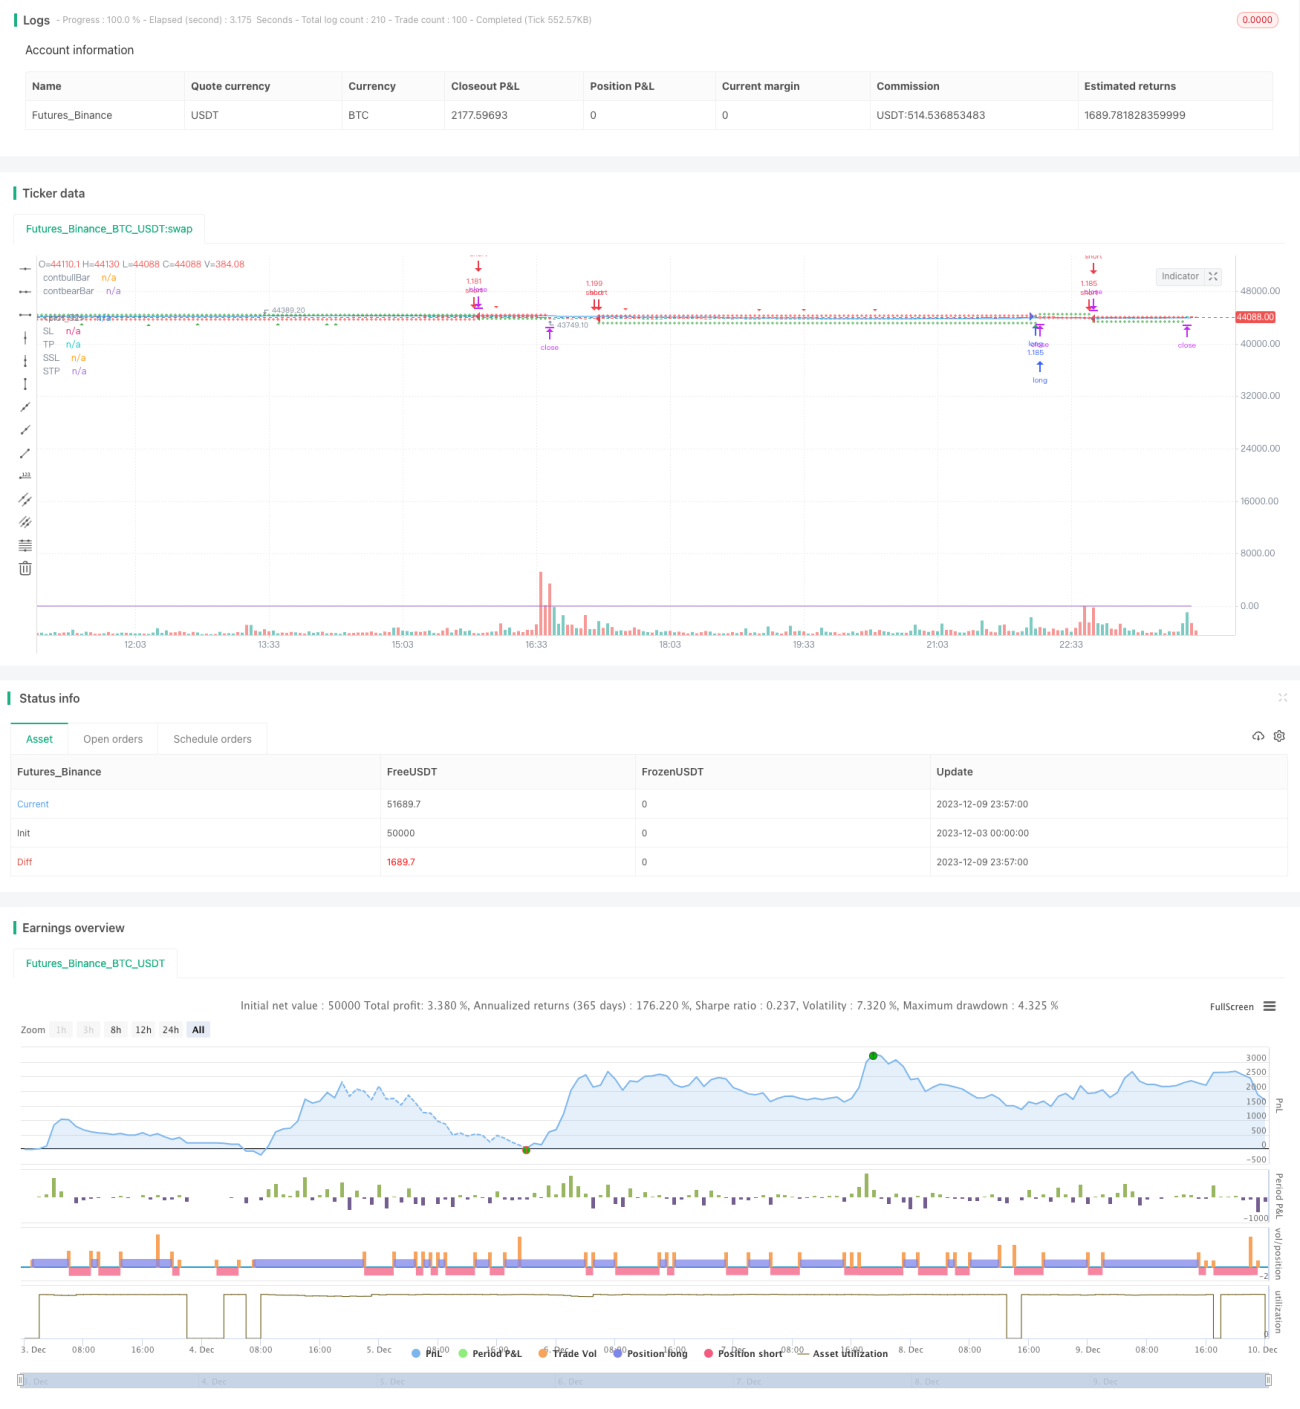

/*backtest
start: 2023-12-03 00:00:00
end: 2023-12-10 00:00:00
period: 3m
basePeriod: 1m
exchanges: [{"eid":"Futures_Binance","currency":"BTC_USDT"}]
*/

// This source code is subject to the terms of the Mozilla Public License 2.0 at https://mozilla.org/MPL/2.0/

// From "Day Trading Cryptocurrency 
// Strategies, Tactics, Mindset, and Tools Required To Build Your 
// New Income Stream"
// by Phil C. Senior

// "Inside bars are a two -bar pattern. They can indicate either a continuation of the 
// existing move or a reversal. A continuation occurs when there is no significant 
// support or resistance level in sight, while a reversal occurs close to a strong sup- 
// port or resistance level...
// ...A lot of traders are aware of inside bars but few manage to make money with 
// them. Why is this so? It goes back to interpreting price action. A lot of traders look 
// to trade in geometric ways. What I mean is that they search for fancy shapes on a 
// chart and think that this is what represents true price action. 
// This is not the case. A shape is just a shape. The formation by itself means 
// nothing unless underlying order flow backs it up. This is why it’s extremely impor- 
// tant that you look for inside bars when a trend is already in place. The best place to 
// look for them is in the beginning of trends."

// © tweakerID

//@version=4
strategy("Inside Bar Strategy w/ SL", 
     overlay=true, 
     default_qty_type=strategy.percent_of_equity, 
     default_qty_value=100, 
     initial_capital=10000, 
     commission_value=0.04, 
     calc_on_every_tick=false, 
     slippage=0)

direction = input(0, title = "Strategy Direction", type=input.integer, minval=-1, maxval=1)
strategy.risk.allow_entry_in(direction == 0 ? strategy.direction.all : (direction < 0 ? strategy.direction.short : strategy.direction.long))

/////////////////////// STRATEGY INPUTS ////////////////////////////////////////
title1=input(true, "-----------------Strategy Inputs-------------------")  

i_NBars = input(defval=1, type=input.integer, title="# Of Inside Bars in pattern", options=[1, 2, 3, 4])
i_BarsDirection = input(false, title="Only trade using complete bullish or bearish patterns")
i_MAFilter = input(true, title="Use MA Trend Filter")
i_MALen = input(65, title="MA Length")

/////////////////////// BACKTESTER /////////////////////////////////////////////
title2=input(true, "-----------------General Inputs-------------------")  

// Backtester General Inputs
i_SL=input(true, title="Use Stop Loss and Take Profit")
i_SLType=input(defval="ATR Stop", title="Type Of Stop", options=["Strategy Stop", "Swing Lo/Hi", "ATR Stop"])
i_SPL=input(defval=10, title="Swing Point Lookback")
i_PercIncrement=input(defval=1, step=.1, title="Swing Point SL Perc Increment")*0.01
i_ATR = input(14, title="ATR Length")
i_ATRMult = input(5, step=.1, title="ATR Multiple")
i_TPRRR = input(2, step=.1, title="Take Profit Risk Reward Ratio")
TS=input(false, title="Trailing Stop")

// Bought and Sold Boolean Signal
bought = strategy.position_size > strategy.position_size[1] 
 or strategy.position_size < strategy.position_size[1]

// Price Action Stop and Take Profit
LL=(lowest(i_SPL))*(1-i_PercIncrement)
HH=(highest(i_SPL))*(1+i_PercIncrement)
LL_price = valuewhen(bought, LL, 0)
HH_price = valuewhen(bought, HH, 0)
entry_LL_price = strategy.position_size > 0 ? LL_price : na 
entry_HH_price = strategy.position_size < 0 ? HH_price : na 
tp=strategy.position_avg_price + (strategy.position_avg_price - entry_LL_price)*i_TPRRR
stp=strategy.position_avg_price - (entry_HH_price - strategy.position_avg_price)*i_TPRRR

// ATR Stop
ATR=atr(i_ATR)*i_ATRMult
ATRLong = ohlc4 - ATR
ATRShort = ohlc4 + ATR
ATRLongStop = valuewhen(bought, ATRLong, 0)
ATRShortStop = valuewhen(bought, ATRShort, 0)
LongSL_ATR_price = strategy.position_size > 0 ? ATRLongStop : na 
ShortSL_ATR_price = strategy.position_size < 0 ? ATRShortStop : na 
ATRtp=strategy.position_avg_price + (strategy.position_avg_price - LongSL_ATR_price)*i_TPRRR
ATRstp=strategy.position_avg_price - (ShortSL_ATR_price - strategy.position_avg_price)*i_TPRRR


// Strategy Stop
float LongStop = valuewhen(bought,low[1],0)*(1-i_PercIncrement)
float ShortStop = valuewhen(bought,high[1],0)*(1+i_PercIncrement)
float StratTP = na
float StratSTP = na

/////////////////////// STRATEGY LOGIC /////////////////////////////////////////

MAFilter=close > sma(close, i_MALen)
plot(i_MAFilter ? sma(close, i_MALen) : na)
bullBar=close > open
bearBar=close < open
contbullBar=barssince(not bullBar) >= (i_NBars+1)
contbearBar=barssince(not bearBar) >= (i_NBars+1)

InsideBar(NBars) =>
    Inside1Bar=high < high[1] and low > low[1] 
    Inside2Bar=high < high[2] and low > low[2] and Inside1Bar
    Inside3Bar=high < high[3] and low > low[3] and Inside1Bar and Inside2Bar
    Inside4Bar=high < high[4] and low > low[4] and Inside1Bar and Inside2Bar and Inside3Bar
    if NBars == 1
        inside1Bar=Inside1Bar
        [inside1Bar]
    else if NBars == 2
        inside2Bar=Inside2Bar
        [inside2Bar]
    else if NBars == 3
        inside3Bar=Inside3Bar   
        [inside3Bar]
    else if NBars == 4
        inside4Bar=Inside4Bar
        [inside4Bar]
    else
        [na]
[insideBar] = InsideBar(i_NBars) 
    
bullInsideBar=bar_index > 40 and insideBar and bullBar 
     and (i_BarsDirection ? contbullBar : true) and (i_MAFilter ? MAFilter : true)
bearInsideBar=bar_index > 40 and insideBar and bearBar 
     and (i_BarsDirection ? contbearBar : true) and (i_MAFilter ? not MAFilter : true)

BUY = bullInsideBar
SELL = bearInsideBar

//Debugging Plots
plot(contbullBar ? 1:0, transp=100, title="contbullBar")
plot(contbearBar ? 1:0, transp=100, title="contbearBar")

//Trading Inputs
DPR=input(true, "Allow Direct Position Reverse")
reverse=input(false, "Reverse Trades")

// Entries
if reverse
    if not DPR
        strategy.entry("long", strategy.long, when=SELL and strategy.position_size == 0)
        strategy.entry("short", strategy.short, when=BUY and strategy.position_size == 0)
    else     
        strategy.entry("long", strategy.long, when=SELL)
        strategy.entry("short", strategy.short, when=BUY)
else
    if not DPR 
        strategy.entry("long", strategy.long, when=BUY and strategy.position_size == 0)
        strategy.entry("short", strategy.short, when=SELL and strategy.position_size == 0)
    else
        strategy.entry("long", strategy.long, when=BUY)
        strategy.entry("short", strategy.short, when=SELL)

SL= i_SLType == "Swing Lo/Hi" ? entry_LL_price : i_SLType == "ATR Stop" ? LongSL_ATR_price : LongStop
SSL= i_SLType == "Swing Lo/Hi" ? entry_HH_price : i_SLType == "ATR Stop" ? ShortSL_ATR_price : ShortStop
TP= i_SLType == "Swing Lo/Hi" ? tp : i_SLType == "ATR Stop" ? ATRtp : StratTP
STP= i_SLType == "Swing Lo/Hi" ? stp : i_SLType == "ATR Stop" ? ATRstp : StratSTP

//TrailingStop
dif=(valuewhen(strategy.position_size>0 and strategy.position_size[1]<=0, high,0))
 -strategy.position_avg_price
trailOffset     = strategy.position_avg_price - SL
var tstop = float(na)
if strategy.position_size > 0
    tstop := high- trailOffset - dif
    if tstop<tstop[1]
        tstop:=tstop[1]
else
    tstop := na
StrailOffset     = SSL - strategy.position_avg_price
var Ststop = float(na)
Sdif=strategy.position_avg_price-(valuewhen(strategy.position_size<0 
 and strategy.position_size[1]>=0, low,0))
if strategy.position_size < 0
    Ststop := low+ StrailOffset + Sdif
    if Ststop>Ststop[1]
        Ststop:=Ststop[1]
else
    Ststop := na

strategy.exit("TP & SL", "long", limit=TP, stop=TS? tstop : SL, when=i_SL)
strategy.exit("TP & SL", "short", limit=STP, stop=TS? Ststop : SSL, when=i_SL)

/////////////////////// PLOTS //////////////////////////////////////////////////

plot(i_SL and strategy.position_size > 0 and not TS ? SL : i_SL and strategy.position_size > 0 and TS ? tstop : na , title='SL', style=plot.style_cross, color=color.red)
plot(i_SL and strategy.position_size < 0 and not TS ? SSL : i_SL and strategy.position_size < 0 and TS ? Ststop : na , title='SSL', style=plot.style_cross, color=color.red)
plot(i_SL and strategy.position_size > 0 ? TP : na, title='TP', style=plot.style_cross, color=color.green)
plot(i_SL and strategy.position_size < 0 ? STP : na, title='STP', style=plot.style_cross, color=color.green)
// Draw price action setup arrows
plotshape(BUY ? 1 : na, style=shape.triangleup, location=location.belowbar, 
 color=color.green, title="Bullish Setup", size=size.auto)
plotshape(SELL ? 1 : na, style=shape.triangledown, location=location.abovebar, 
 color=color.red, title="Bearish Setup", size=size.auto)


More