RSI-MA Trend Following Strategy

Overview
This strategy is named "RSI-MA Trend Following Strategy". The idea is to use both the RSI indicator and MA lines to judge price trends and generate trading signals. Trading signals are generated when the RSI indicator exceeds the pre-set upper and lower thresholds, while the MA lines are used to filter out false signals, only issuing signals when prices continue to rise or fall. This allows maintaining decent profit potential while effectively filtering out range-bound price movements.
Strategy Logic
The core components of this strategy are the RSI indicator and MA lines. The RSI is used to identify overbought and oversold levels, while the MA is used to determine trend directionality. The specific logic is:
-
Calculate the RSI indicator value, and set the upper threshold at 90 and lower threshold at 10. An RSI reading above 90 signifies an overbought signal, while a reading below 10 signifies an oversold signal.
-
Calculate the MA line of a certain period (e.g. 4 days). When prices are continuously rising, the MA line tilts upwards. When prices are falling continuously, the MA line tilts downwards.
-
When the RSI exceeds 90 and the MA line tilts upwards, go short. When the RSI drops below 10 and the MA line tilts downwards, go long.
-
Set stop loss at a fixed number of points per contract, and take profit at a fixed percentage per contract.
Advantage Analysis
This strategy combines the dual filters of RSI indicator and MA lines, which can effectively filter out false signals under range-bound price moves. Meanwhile, the RSI settings avoid delayed signals and maintain decent profit potential. Using the MA to determine trend directionality prevents trading against the trend. In addition, the strategy has simple parameters that are easy to comprehend and optimize.
Risk Analysis
Main risks of this strategy include:
-
Sudden events that cause sharp price spikes may not be reflected timely in RSI and MA readings, leading to larger losses.
-
Under range-bound markets, RSI and MA may frequently issue signals, resulting in overly frequent trading that increases transaction costs and slippage.
-
Improper parameter settings can also impact strategy performance. For example, RSI upper/lower thresholds set too wide lead to signal delays, while thresholds set too narrow lead to too frequent signals.
Optimization Directions
Areas for further optimization include:
-
Backtest and optimize parameters over different products and timeframes to find the optimal parameter combinations.
-
Incorporate other indicators alongside RSI/MA, such as KDJ, BOLL etc, to set more stringent signal filters and reduce false signals.
-
Build adaptive stop loss/take profit mechanisms based on volatility and ATR to dynamically adjust price levels.
-
Add machine learning algorithms to auto-adjust parameters based on changing market conditions, realizing dynamic parameter optimization.
Conclusion
Overall this RSI-MA strategy is fairly simple and practical, combining elements of trend following and overbought/oversold analysis. It can achieve decent profits given favorable market conditions, but also carries risks of false signals that need to be reduced via further optimizations to improve robustness.
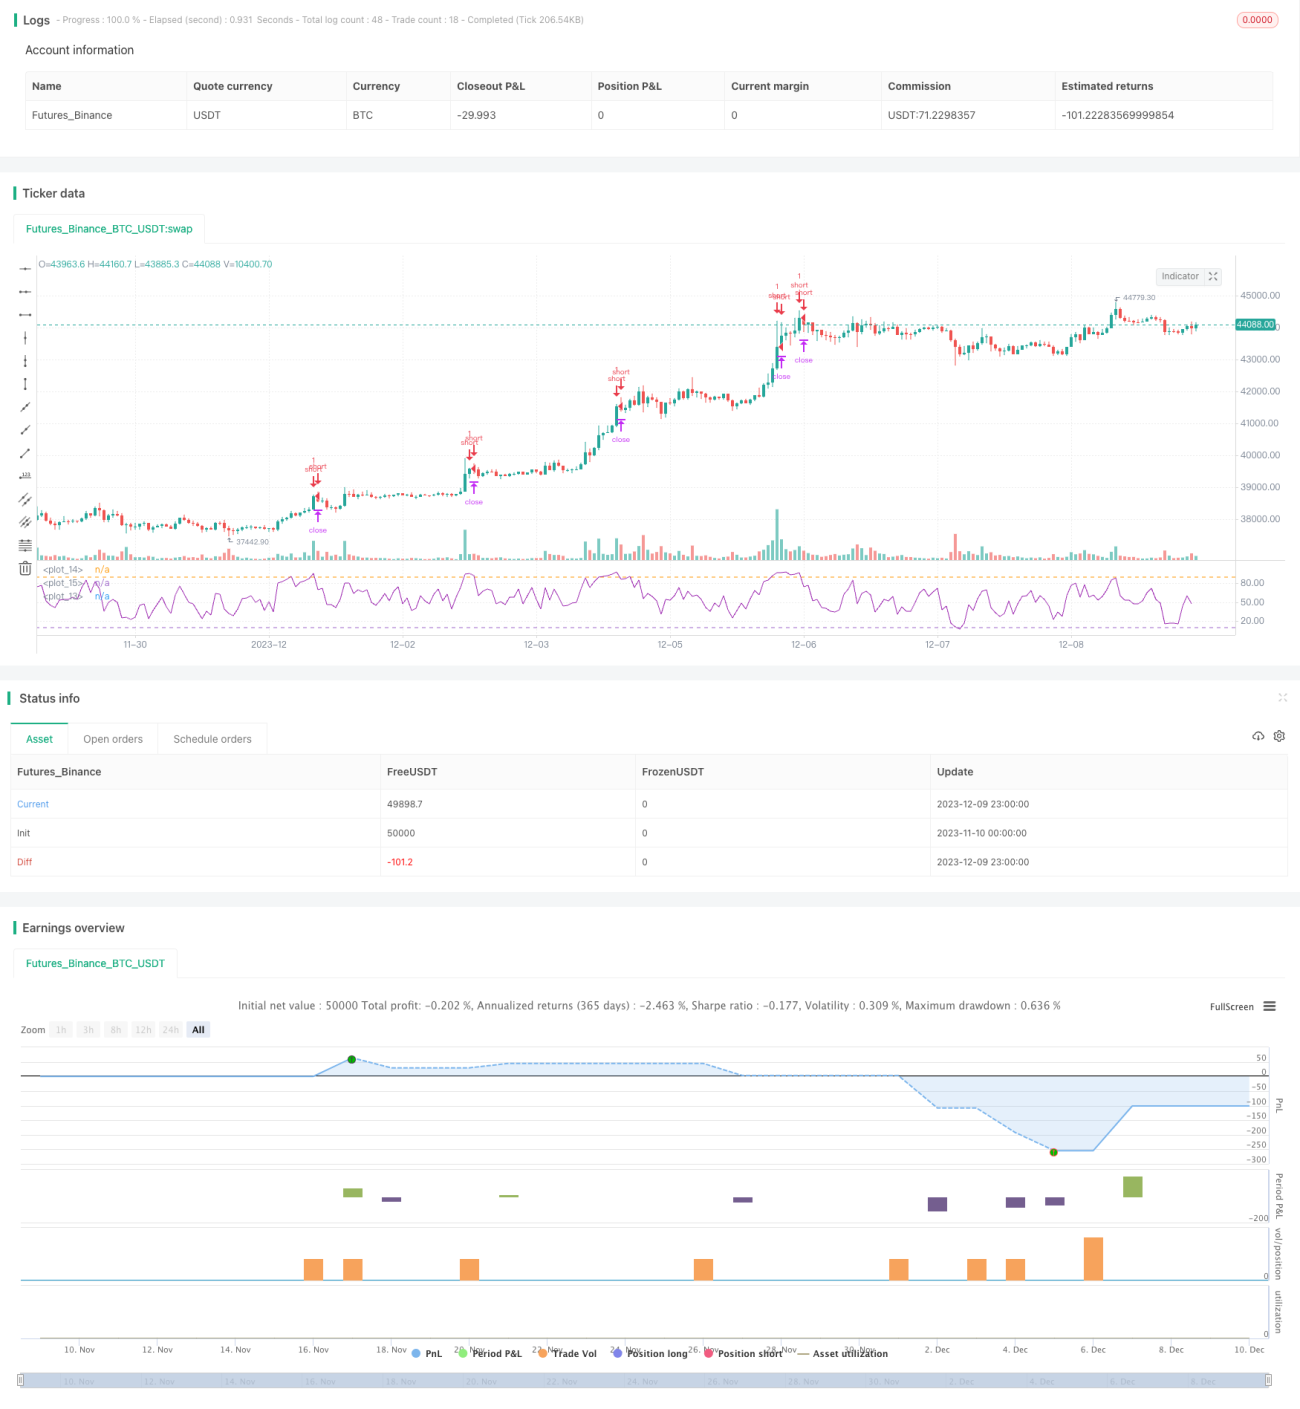
/*backtest
start: 2023-11-10 00:00:00
end: 2023-12-10 00:00:00
period: 1h
basePeriod: 15m
exchanges: [{"eid":"Futures_Binance","currency":"BTC_USDT"}]
*/

//@version=2
//This strategy is best used with the Chrome Extension AutoView for automating TradingView alerts.
//You can get the AutoView extension for FREE using the following link
//https://chrome.google.com/webstore/detail/autoview/okdhadoplaoehmeldlpakhpekjcpljmb?utm_source=chrome-app-launcher-info-dialog- 1