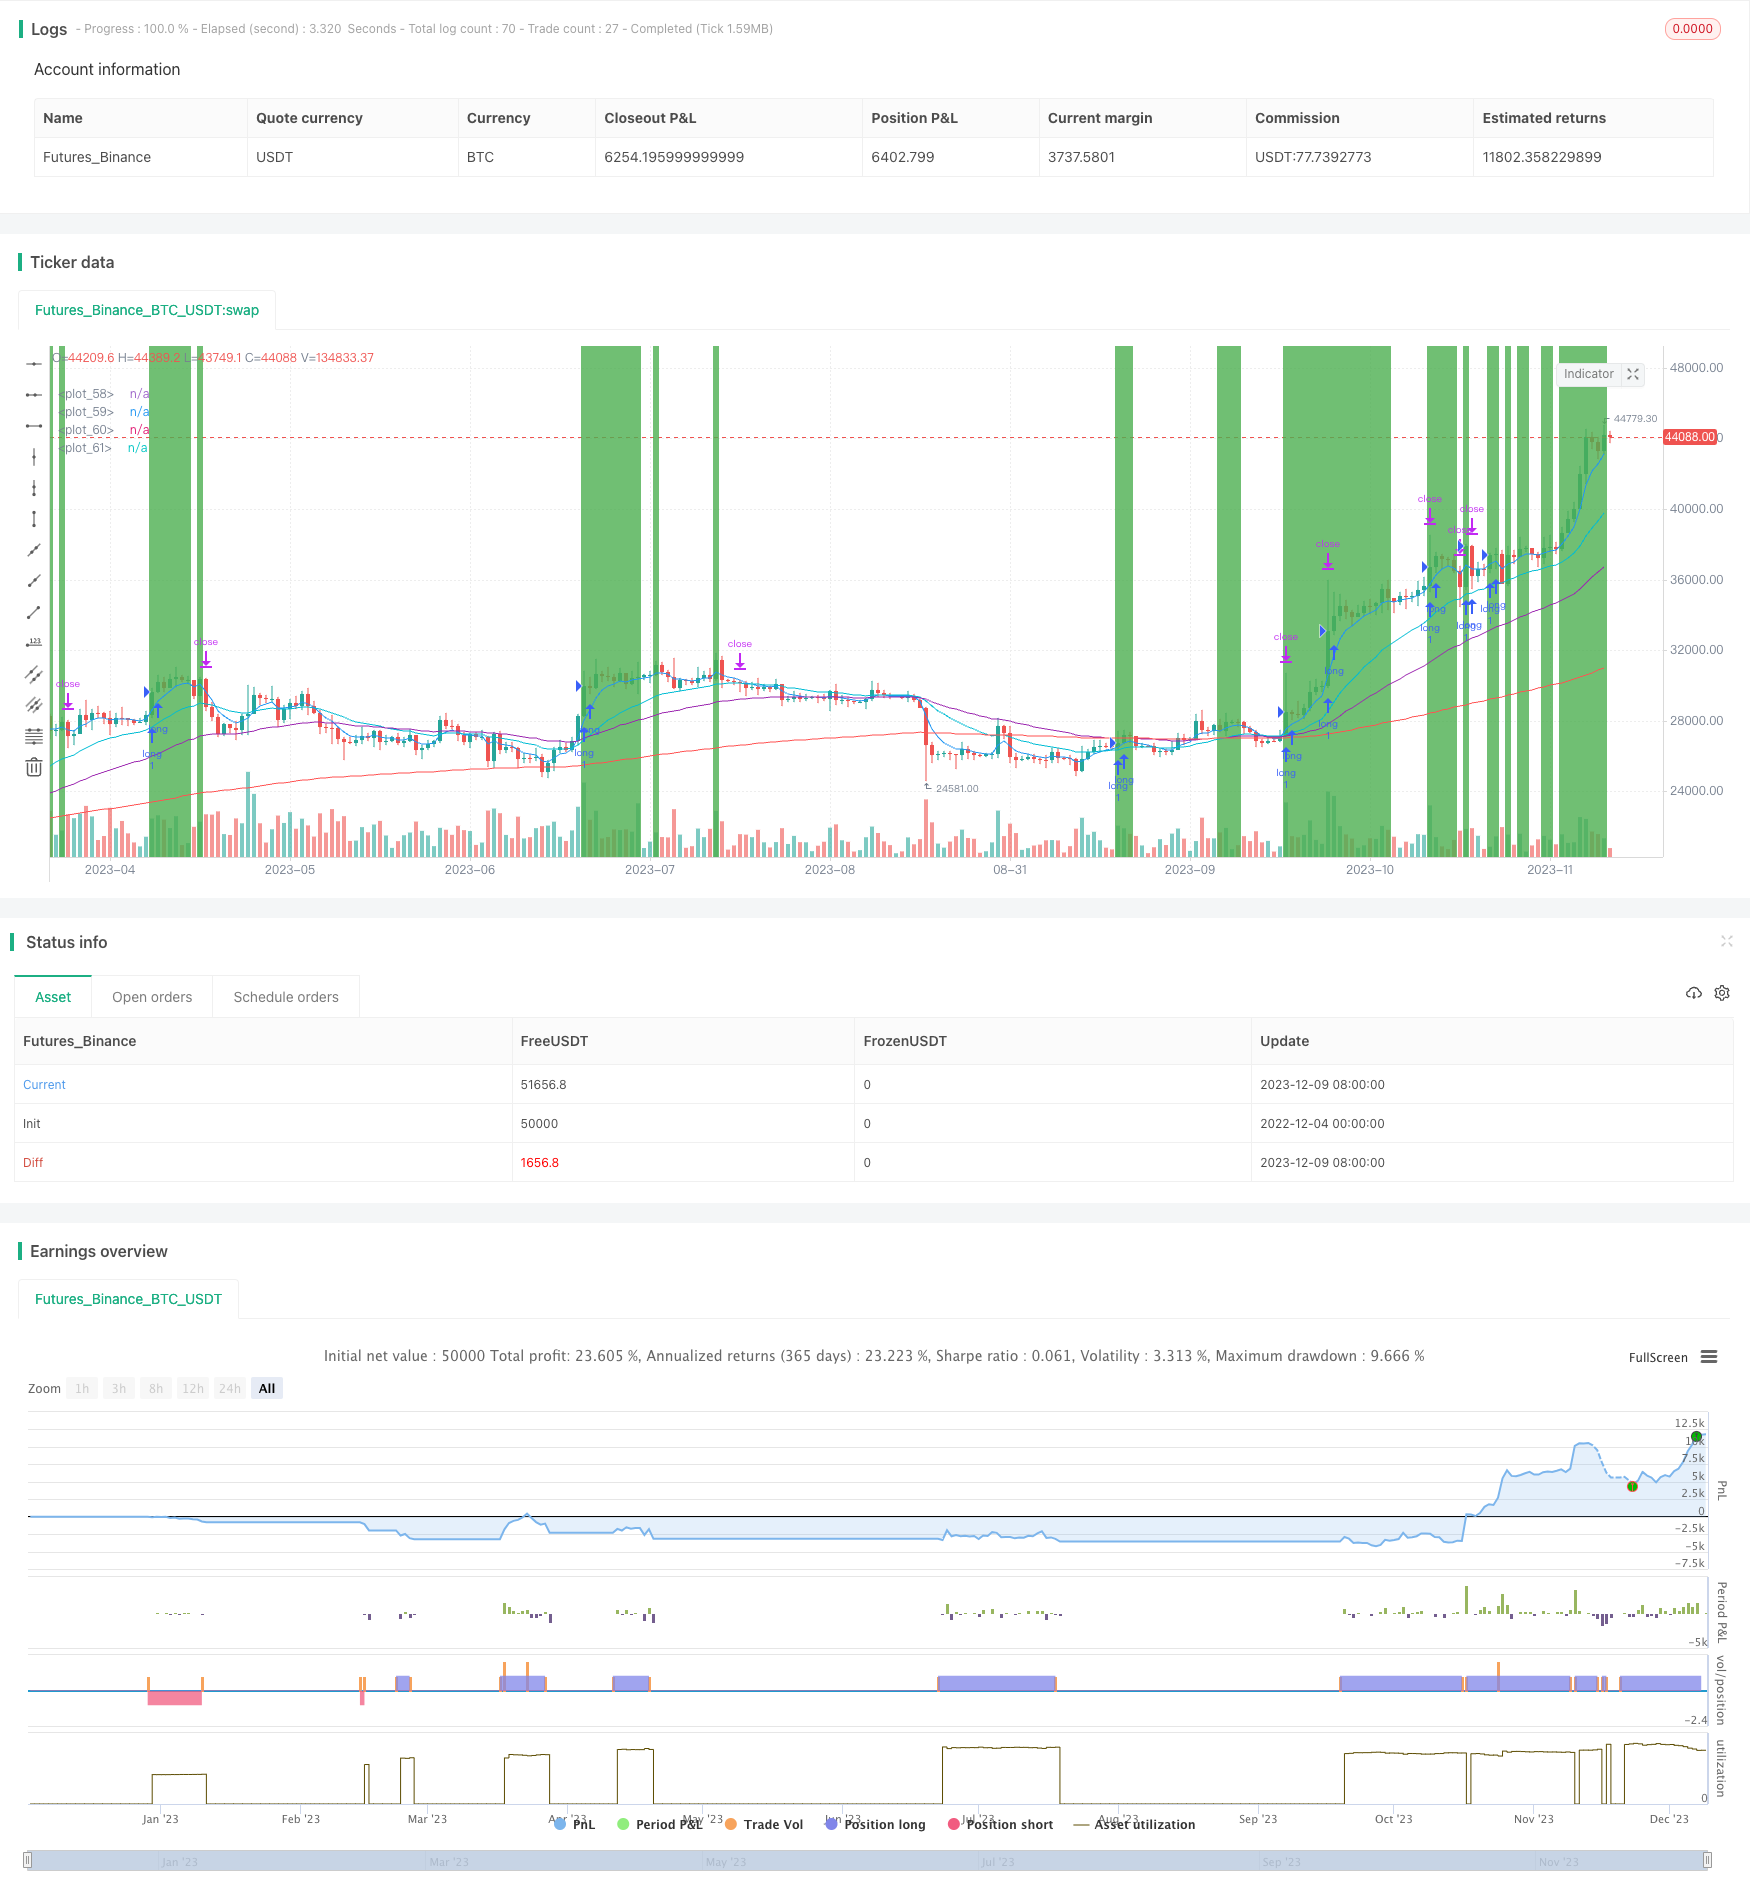
概述
本策略名称为“四因子动量追踪策略”。该策略综合运用平均方向运动指标(ADX)判断趋势方向、布林带百分比B波段(BB %B)判断股票相对强弱、神奇均线(AO)判断动量以及不同周期的指数移动平均线(EMA)判断多空,实现对股票价格的动态跟踪,追捧强势股、回避弱势股的效果。
策略原理
该策略运用四个不同的技术指标判断买入和卖出时机。具体判断逻辑如下:
多头进入条件:5日EMA上穿21日EMA,50日EMA上穿200日EMA,BB %B大于设定的过买线,AO大于设定的正值,ADX大于设定值。
空头进入条件:5日EMA下穿21日EMA,50日EMA下穿200日EMA,BB %B小于设定的过卖线,AO小于设定的负值,ADX大于设定值。
策略优势分析
该策略综合多个指标判断趋势方向和 stocks的相对强弱,可以有效过滤假突破。具体优势如下:
ADX指标可以有效判断趋势的存在以及趋势的力度,避免在震荡市中频繁开仓;
BB %B指标判断个股是否处于“高位”或“低位”,可以有效避免追高杀跌;
AO指标判断买入时是否存在较强的动量支撑,保证突破的有效性;
EMA指标的金叉/死叉结合判断市场主流方向,避免逆势开仓。
综上,该策略可以有效控制交易风险,追踪市场中的强势个股。
风险分析
尽管该策略综合运用多种指标控制风险,但仍存在一定的风险:
多个指数型指标组合使用,对参数调整敏感,不恰当的参数组合可能无法发挥应有效果。
过于追求动量可能错过市场真正的反转点位。应适当控制持仓周期,及时止盈止损。
EMA等指标具有滞后性,可能无法及时反映突发事件的影响。应适当配合其他指标或适当缩短MA周期。
突发重大事件可能导致指标发散,应结合基本面分析,必要时可以暂时关闭策略。
优化方向
该策略还可从以下几个方面进行优化:
运用机器学习等方法寻找最佳参数组合。
加入其他判断趋势指标,如CCI,MACD等,形成“指标组合”,提高判断准确性。
加入止盈止损策略,控制单笔损失。
设定持仓时间,避免过度贪婪。
总结
本策略名称为“四因子动量追踪策略”,运用ADX、BB %B、AO和EMA四个指标判断买卖时机,实现对强势个股的动态跟踪。该策略能有效判断趋势方向和股票的相对强弱,控制交易风险。下一步可通过参数优化、加入其他指标以及设置持仓时间等方式进一步完善该策略。
/*backtest
start: 2022-12-04 00:00:00
end: 2023-12-10 00:00:00
period: 1d
basePeriod: 1h
exchanges: [{"eid":"Futures_Binance","currency":"BTC_USDT"}]
*/

//@version=4

//ADX + BB %B + AO + EMA

strategy("ADX + BB %B + AO + EMA", overlay=true, initial_capital=10000)
take_profit_perc = input(title="Take Profit %", type=input.integer, defval=10, minval=1, maxval=100)
stop_loss_perc = input(title="Stop Loss %", type=input.integer, defval=5, minval=1, maxval=100)
bb_overbought = input(title="BB %B Overbought", type=input.integer, defval=75, minval=1, maxval=100)
bb_oversold = input(title="BB %B Oversold", type=input.integer, defval=25, minval=1, maxval=100)
ao_value = input(title="Awesome Oscillator", type=input.integer, defval=2)
adx_value = input(title="ADX", type=input.integer, defval=15)

startDate = input(title="Start Date", type=input.integer, defval=1, minval=1, maxval=31)
startMonth = input(title="Start Month", type=input.integer, defval=1, minval=1, maxval=12)
startYear = input(title="Start Year", type=input.integer, defval=2018, minval=2008, maxval=2200)

inDateRange = (time >= timestamp(syminfo.timezone, startYear, startMonth, startDate, 0, 0))

ema5 = ema(close, 5)
ema21 = ema(close, 21)
ema50 = ema(close, 50)
ema200 = ema(close, 200)

//BB %B
length = input(20, minval=1)
src = input(close, title="Source")
mult = input(2.0, minval=0.001, maxval=50, title="StdDev")
basis = sma(src, length)
dev = mult * stdev(src, length)
upper = basis + dev
lower = basis - dev
bbr = (src - lower)/(upper - lower)

//Awesome Oscillator
ao = sma(hl2,5) - sma(hl2,34)

// ADX
adxlen = input(14, title="ADX Smoothing")
dilen = input(14, title="DI Length")
dirmov(len) =>
	up = change(high)
	down = -change(low)
	plusDM = na(up) ? na : (up > down and up > 0 ? up : 0)
	minusDM = na(down) ? na : (down > up and down > 0 ? down : 0)
	truerange = rma(tr, len)
	plus = fixnan(100 * rma(plusDM, len) / truerange)
	minus = fixnan(100 * rma(minusDM, len) / truerange)
	[plus, minus]
adx(dilen, adxlen) =>
	[plus, minus] = dirmov(dilen)
	sum = plus + minus
	adx = 100 * rma(abs(plus - minus) / (sum == 0 ? 1 : sum), adxlen)
sig = adx(dilen, adxlen)

long_strategy = ema5>ema21 and ema50>ema200 and bbr>(bb_overbought/100) and ao>ao_value and sig>adx_value
short_strategy = ema5<ema21 and ema50<ema200 and bbr<(bb_oversold/100) and ao<-ao_value and sig>adx_value

plot(ema5, color=color.blue)
plot(ema21, color=color.aqua)
plot(ema50, color=color.purple)
plot(ema200, color=color.red)
bgcolor(color=long_strategy ? color.green : na, transp=80)
bgcolor(color=short_strategy ? color.purple : na, transp=80)

if inDateRange and long_strategy
    strategy.entry("long", strategy.long)
    strategy.exit("exit", "long", stop=close*(100-stop_loss_perc)/100, limit=close*(100+take_profit_perc)/100)
if inDateRange and short_strategy
    strategy.entry("short", strategy.short)
    strategy.exit("exit", "short", stop=close*(100+stop_loss_perc)/100, limit=close*(100-take_profit_perc)/100)