Dynamic Rising ADX Trend Following Strategy

Author: ChaoZhang, Date: 2023-12-11 17:18:32
Tags:

img

Overview

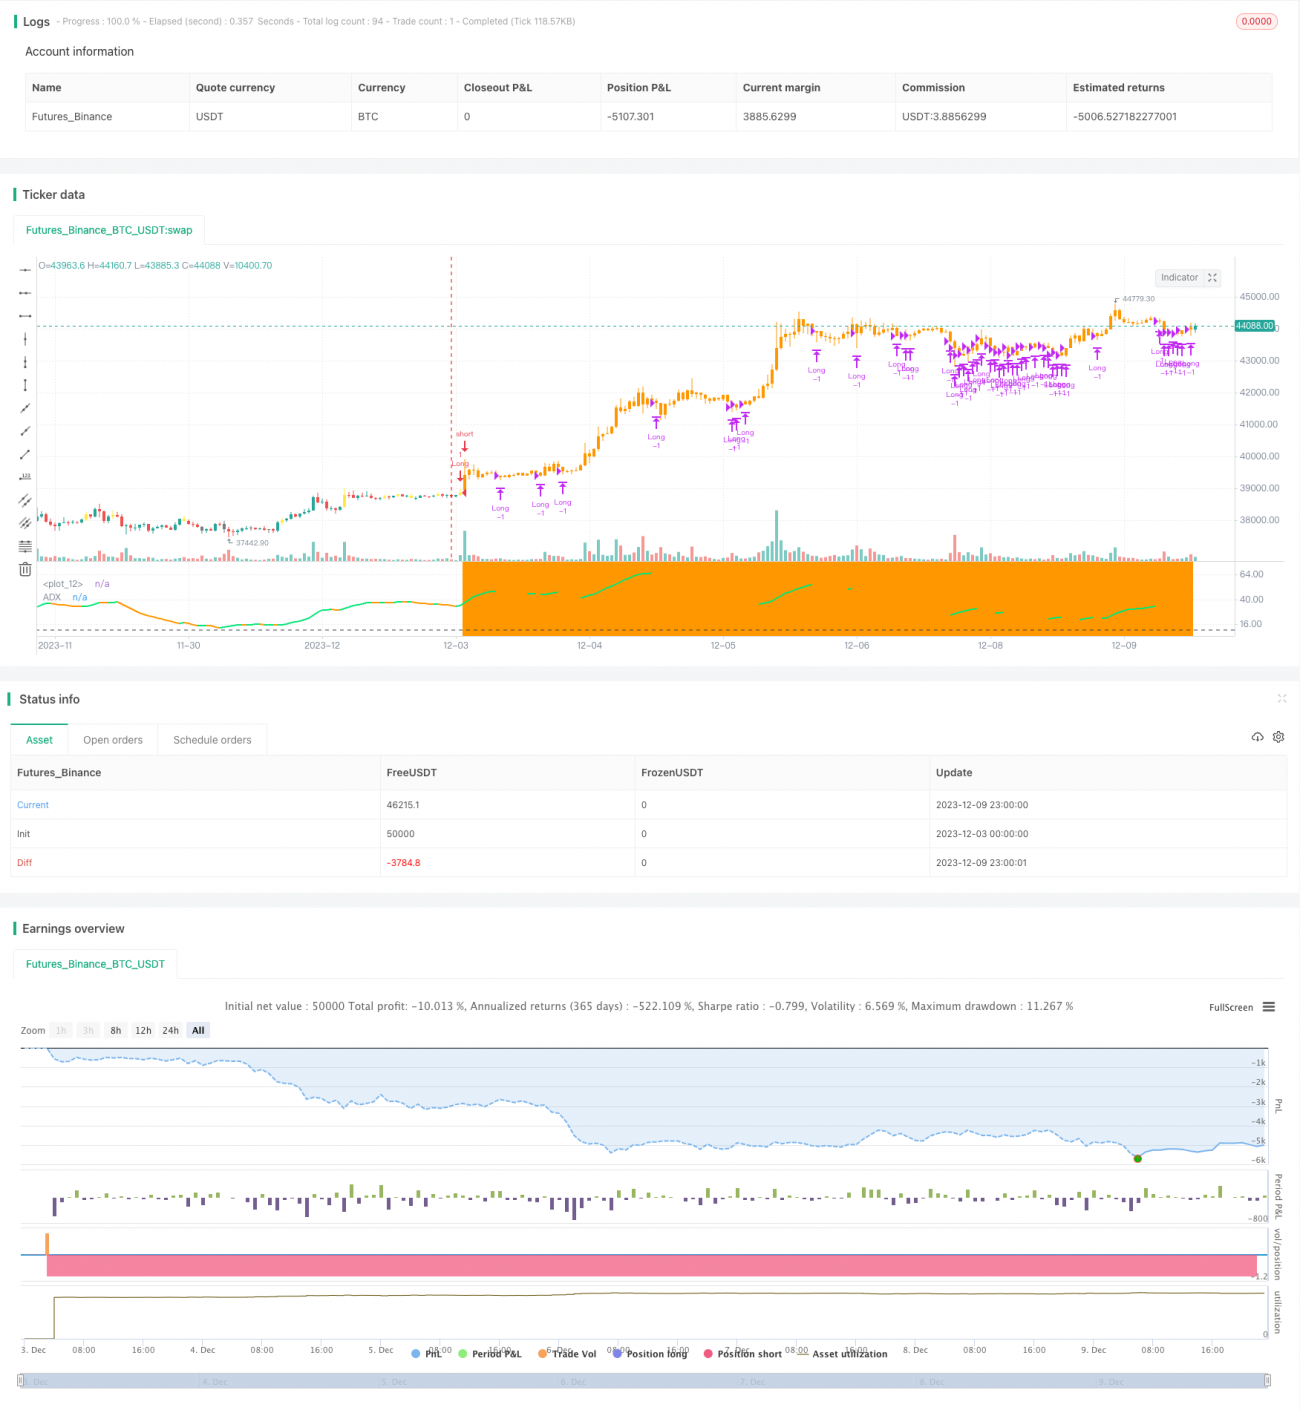
This strategy tracks the dynamic changes of the ADX indicator to capture the early shifts in market trends for timely trend following. When ADX rises quickly from low levels, it signals a trend is forming which presents a great opportunity to enter. With the assistance of moving averages, it can filter out false signals effectively.

Strategy Logic

The core of this strategy lies in judging trend development based on the dynamic changes of the ADX indicator. Low ADX signifies small fluctuations in trends. When ADX rises swiftly from low levels, it signals a trend is forming. The strategy captures trend emergence by monitoring the sharp increase of ADX.

Specifically, the entry signal consists of the following factors:

  1. ADX crosses above a threshold (e.g. 10)
  2. ADX rises swiftly upwards
  3. Price crosses above Simple or Exponential Moving Average

When all conditions above are met, it signals an uptrend is forming to go long. When price falls below moving averages, close positions. Two moving averages are used to judge trends more precisely.

The stop loss logic is similar. Go short when ADX drops swiftly, and close positions when price rises above moving averages.

Advantage Analysis

The biggest edge here is the timely capturing of emerging trends. The conventional way of looking at absolute ADX values often requires confirmation above 20 or 25 to call a trend, thus missing the optimal entry timing. This strategy grasps the trend’s early development by tracking the swift rise of ADX.

Moreover, the moving averages help filter out false signals effectively, enhancing the stability of the strategy.

Risk and Optimization Analysis

The biggest risk comes from the lagging nature of the ADX itself. Despite catching the swift rise to reduce the lag, there is still some delay. This causes missing out on some rapidly reversing markets.

Also, ADX does not perfectly judge trends and inevitably misdiagnoses them from time to time. The moving averages filter out some noise but need further optimization.

There is still large room for optimizing this strategy, mainly enhancing ADX’s accuracy in capturing trends. Methods like machine learning can be explored, training models to forecast probability distribution based on ADX changes. Other aspects like parameter tuning, additional indicators etc. can also be tested.

Conclusion

This dynamic rising ADX trend following strategy captures trend shifts swiftly by identifying sharp ADX rises, thus following trends in a timely manner. The biggest advantage is its agility in time, effectively seizing early trend developments. Meanwhile, certain risks of misjudgment remain that call for continuous optimization and testing.


/*backtest
start: 2023-12-03 00:00:00
end: 2023-12-10 00:00:00
period: 1h
basePeriod: 15m
exchanges: [{"eid":"Futures_Binance","currency":"BTC_USDT"}]
*/

// This source code is subject to the terms of the Mozilla Public License 2.0 at https://mozilla.org/MPL/2.0/
// © dhilipthegreat

//@version=4
//Rising ADX strategy

strategy(title="Rising ADX strategy", overlay=false)

adxlen = input(14, title="ADX Length", minval=1)
threshold = input(10, title="threshold", minval=5)

hline(threshold, color=color.black, linestyle=hline.style_dashed)

atype = input(2,minval=1,maxval=7,title="1=SMA, 2=EMA, 3=WMA, 4=HullMA")
malen=input(20, title="Moving average 1 ",minval=1, maxval=50)
avg = atype == 1 ? sma(close,malen) : atype == 2 ? ema(close,malen) : atype == 3 ? wma(close,malen) : atype == 4 ? hma(close,malen) : na

atype2 = input(2,minval=1,maxval=7,title="1=SMA, 2=EMA, 3=WMA, 4=HullMA")
malen2=input(20, title="Moving average 2",minval=1, maxval=200)
avg2 = atype2 == 1 ? sma(close,malen2) : atype2 == 2 ? ema(close,malen2) : atype2 == 3 ? wma(close,malen2) : atype2 == 4 ? hma(close,malen2) : na

//ADX&DI
dilen = 14
dirmov(len,_high,_low,_tr) =>
	up = change(_high)
	down = -change(_low)
	plusDM = na(up) ? na : (up > down and up > 0 ? up : 0)
    minusDM = na(down) ? na : (down > up and down > 0 ? down : 0)
	truerange = rma(_tr, len)
	
	plus = fixnan(100 * rma(plusDM, len) / truerange)
	minus = fixnan(100 * rma(minusDM, len) / truerange)

	[plus, minus]

adx(dilen, adxlen,_high,_low,_tr) =>
	[plus, minus] = dirmov(dilen,_high,_low,_tr)
	sum = plus + minus
	adx = 100 * rma(abs(plus - minus) / (sum == 0 ? 1 : sum), adxlen)

[plus, minus] = dirmov(dilen,high,low,tr)
sig = adx(dilen, adxlen,high,low,tr)
prev_sig = adx(dilen, adxlen,high[1],low[1],tr)
plot(sig ? sig : na, color = rising(sig, 1) ? color.lime : falling(sig, 1) ? color.orange : color.purple, title="ADX",linewidth=2)

//////
longCondition=  sig > threshold  and rising(sig, 1) and falling(prev_sig, 1) and close > avg and close > avg2
barcolor(longCondition ? color.yellow: na)
Long_side = input(true, "Long side")
if Long_side
    strategy.entry(id="Long", long=true,  when= longCondition  and strategy.position_size<1)
    exitCondition=  (rising(prev_sig, 1) and falling(sig, 1)) or close < avg and close < avg2
    strategy.close(id="Long",comment="L exit",    qty=strategy.position_size ,   when= exitCondition)   //close all

shortCondition=  sig > threshold  and rising(sig, 1) and falling(prev_sig, 1) and close < avg and close < avg2
barcolor(shortCondition ? color.gray: na)
Short_side = input(true, "Short side")
if Short_side
    strategy.entry(id="Short", long=false,  when= shortCondition  and strategy.position_size<1)
    sell_exitCondition=  (rising(prev_sig, 1) and falling(sig, 1)) or close > avg and close > avg2
    strategy.close(id="Short",comment="S exit",    qty=strategy.position_size ,   when= sell_exitCondition)   //close all

barcolor(strategy.position_size>1 ? color.lime: na)
bgcolor(strategy.position_size>1 ? color.lime: na)

barcolor(strategy.position_size<0 ? color.orange: na)
bgcolor(strategy.position_size<0 ? color.orange: na)

More