Quantitative Trading Strategy Based on Trend Analysis Index

Overview
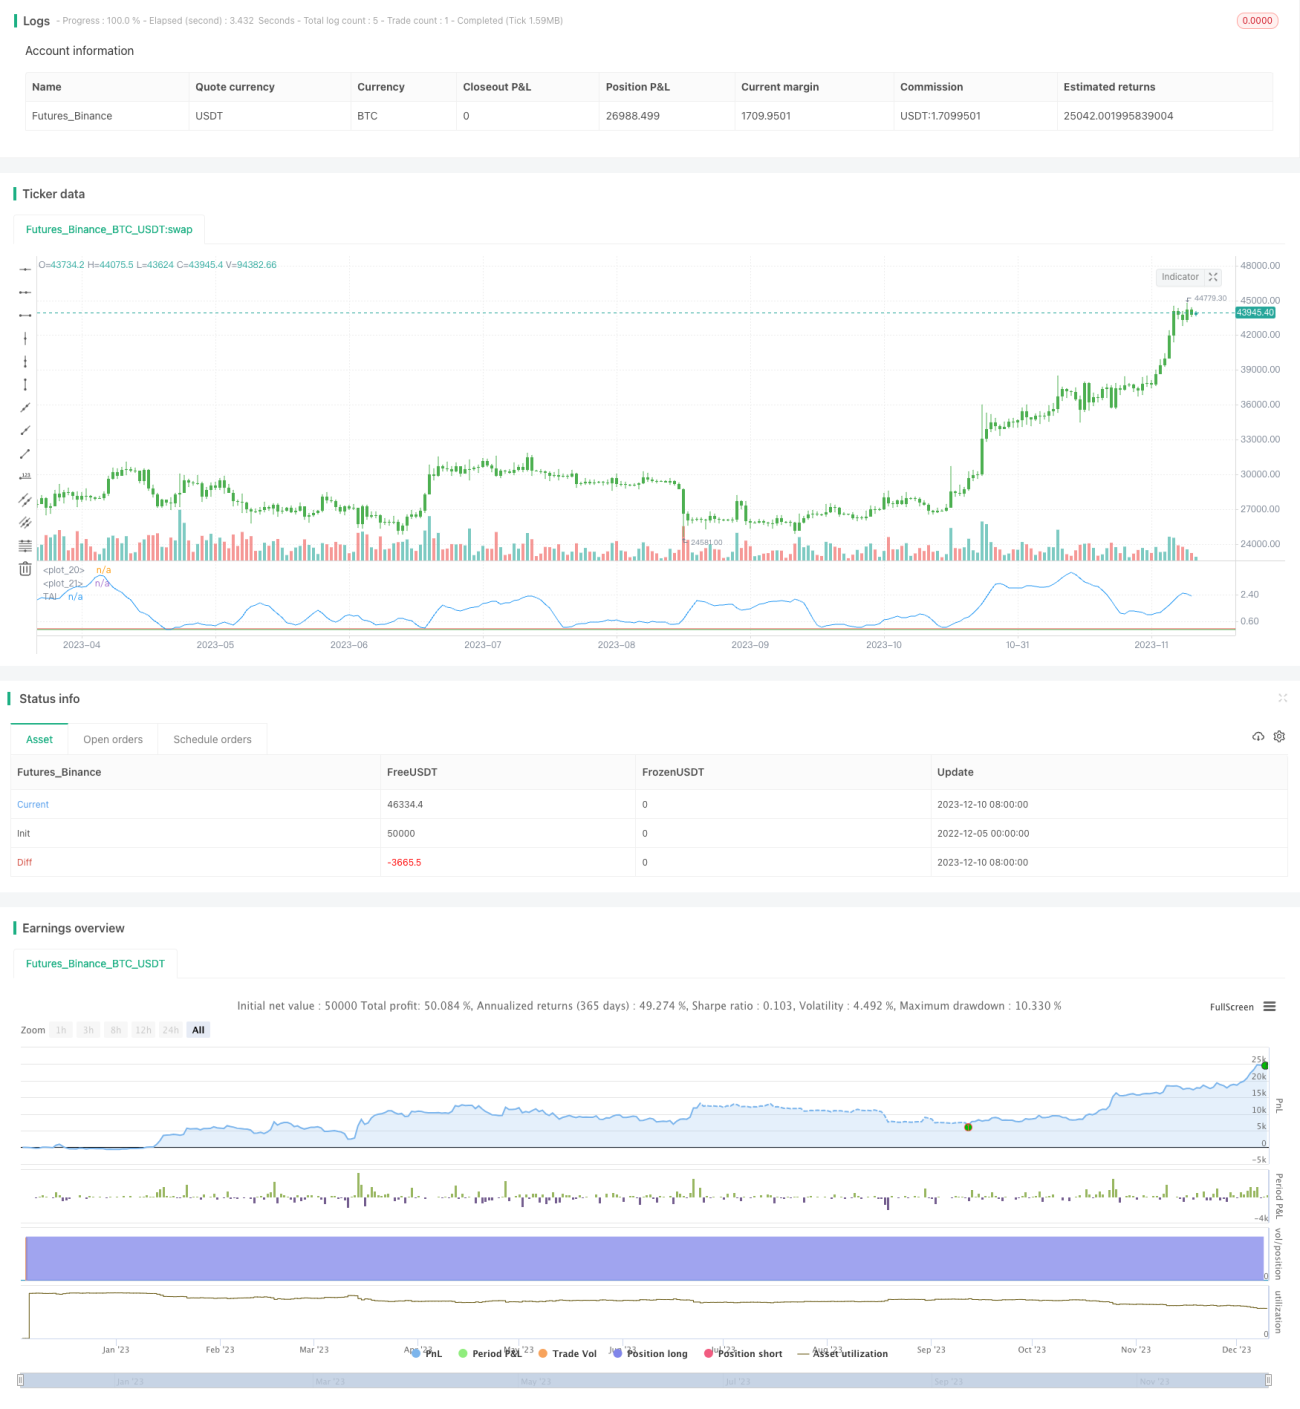
The core idea of this strategy is to use the slope of moving average to judge market trend and construct a Trend Analysis Index (TAI) as trading signal. When price is trending, the slope of moving average increases. When price is ranging in a trendless zone, the slope of moving average decreases. The increase of Trend Analysis Index indicates the start of a trend while the decrease means the end of the trend.
Strategy Logic
The strategy first calculates the Simple Moving Average (X-day MA) of price. Then it computes the highest and lowest value of this moving average in the last Y days to get the fluctuation range. Finally, by comparing this Y-day range with price, it converts to a standardized indicator between 0-1, namely the Trend Analysis Index. Taking long position when index is above a threshold and short position when below another threshold.
Advantage Analysis
The advantages of this strategy are:
- Effectively catching mid- to long-term trends by judging slope of MA
- Constructing standardized index for clearer trading signal
- Customizable MA and trend judgment parameters for different market environments
- Choosable reverse trading for tracking or hedging other strategies
Risk Analysis
There are also some risks:
- Prone to wrong signals during range-bound market
- Missing trend reversal points if MA parameters set inappropriately
- Missing weak trends if standardization parameters set inappropriately
- Increased loss on reverse trading
Solutions:
- Filter signals with other indicators
- Optimize parameters to find best combination
- Adjust threshold of standardization parameters
- Carefully use reverse trading
Optimization Directions
The strategy can be optimized in following aspects:
- Combine other indicators like BOLL to make signals more reliable
- Add stop loss to control single loss
- Optimize MA days to fit characteristics in different timeframes
- Train optimal threshold parameters
- Add ML model for trend probability to assist trading
Conclusion
In summary, this is a mid- to long-term trend following strategy based on the slope of moving average. It can effectively capture trends but also has some false signal risks. By combining with other indicators, adding stop loss, parameter optimization etc, the strategy can be more robust. Essentially it is still a simple trend tracking strategy.
//@version=2
////////////////////////////////////////////////////////////
//  Copyright by HPotter v1.0 21/12/2017
// In essence, it is simply the standard deviation of the last x bars of a
// y-bar moving average. Thus, the TAI is a simple trend indicator when prices
// trend with authority, the slope of the moving average increases, and when
// prices meander in a trendless range, the slope of the moving average decreases.
//
// You can change long to short in the Input Settings
// WARNING:
// - For purpose educate only
// - This script to change bars colors.- 1