Cross-period Value Area Breakout Strategy

Overview
The core idea of this strategy is to determine the current price range by combining RSI indicators of different cycles, and to take corresponding buy or sell actions in smaller cycles when there is a breakout in larger cycle RSI. This strategy takes advantage of technical indicators across different periods to judge the relative value of current price from multiple time dimensions and locate better entry points.
Strategy Logic
The main steps for this strategy to determine price range and find trading opportunities are:
- Calculate the RSI Swing High and Swing Low based on larger cycle (e.g. daily).
- Determine if the larger cycle RSI made a new high or low within the lookback period.
- If there is a breakout, judge the price trend (bullish or bearish) in smaller cycle (e.g. 5 min) and take corresponding buy or sell actions.
For example, when the daily RSI breakout its previous high, we judge that it is currently a bull market. And when the daily RSI break below its previous low, we judge it as a bear market. Under both cases we take long and short actions respectively in the 5 min chart.
Advantage Analysis
Compared with traditional strategies that only focus on one period, this strategy has the following advantages:
-
More accurate assessment of current relative price value. Larger cycles like daily can filter out short-term market noise and determine overall trend and value area.
-
Combining indicators across periods improves signal reliability. Relying solely on single period indicator can generate false signals more easily, while concurrent signals from multiple periods is more reliable.
-
More effectively capitalizing short-term opportunities. Large cycle breakout points out overall direction, while we only need to locate opportunity in small cycles like 5 mins to profit.
-
Smaller drawdowns. Combining cross periods helps avoid being trapped. We can exit quickly when large cycle indicators start to reverse.
Risk Analysis
The main risks of this strategy lies in:
-
Wrong judgement in large cycle indicators. Ineffective value area determination in daily RSI etc can lead to faulty signals. Parameter tuning of RSI is needed to improve accuracy.
-
Divergence between small cycle price move and large cycle determination. Sometimes short-term moves counteract big picture trends. We need to set proper stop loss to control the loss.
-
Improper risk management. Excessive loss in single trade due to poor position sizing could lead to unrecoverable drawdown. Reasonable sizing rules must be implemented.
Optimization Directions
There is still large room to improve this strategy, mainly from the following aspects:
-
Period parameter tuning. Test more period combinations to find optimal parameters.
-
RSI parameter tuning. Adjust RSI lookback etc parameters to improve judgement accuracy.
-
Add more indicators. Bring in more indicators like MA to assist judging trend direction.
-
Improve stop loss mechanism. Dynamically adjust stop loss points based on drawdown conditions.
-
Optimize position sizing rules. Manage specific position sizes for each trade more scientifically.
Conclusion
This strategy realizes cross period arbitrage between different time dimensions by assessing bullish condition in cross period RSIs. Such idea of cross period judgement deserves further exploitation. We can keep improving it via parameter tuning, stop loss optimization, indicator combinations to make it more advantageous. Overall speaking, this strategy has a unique idea and huge potential to be enhanced.
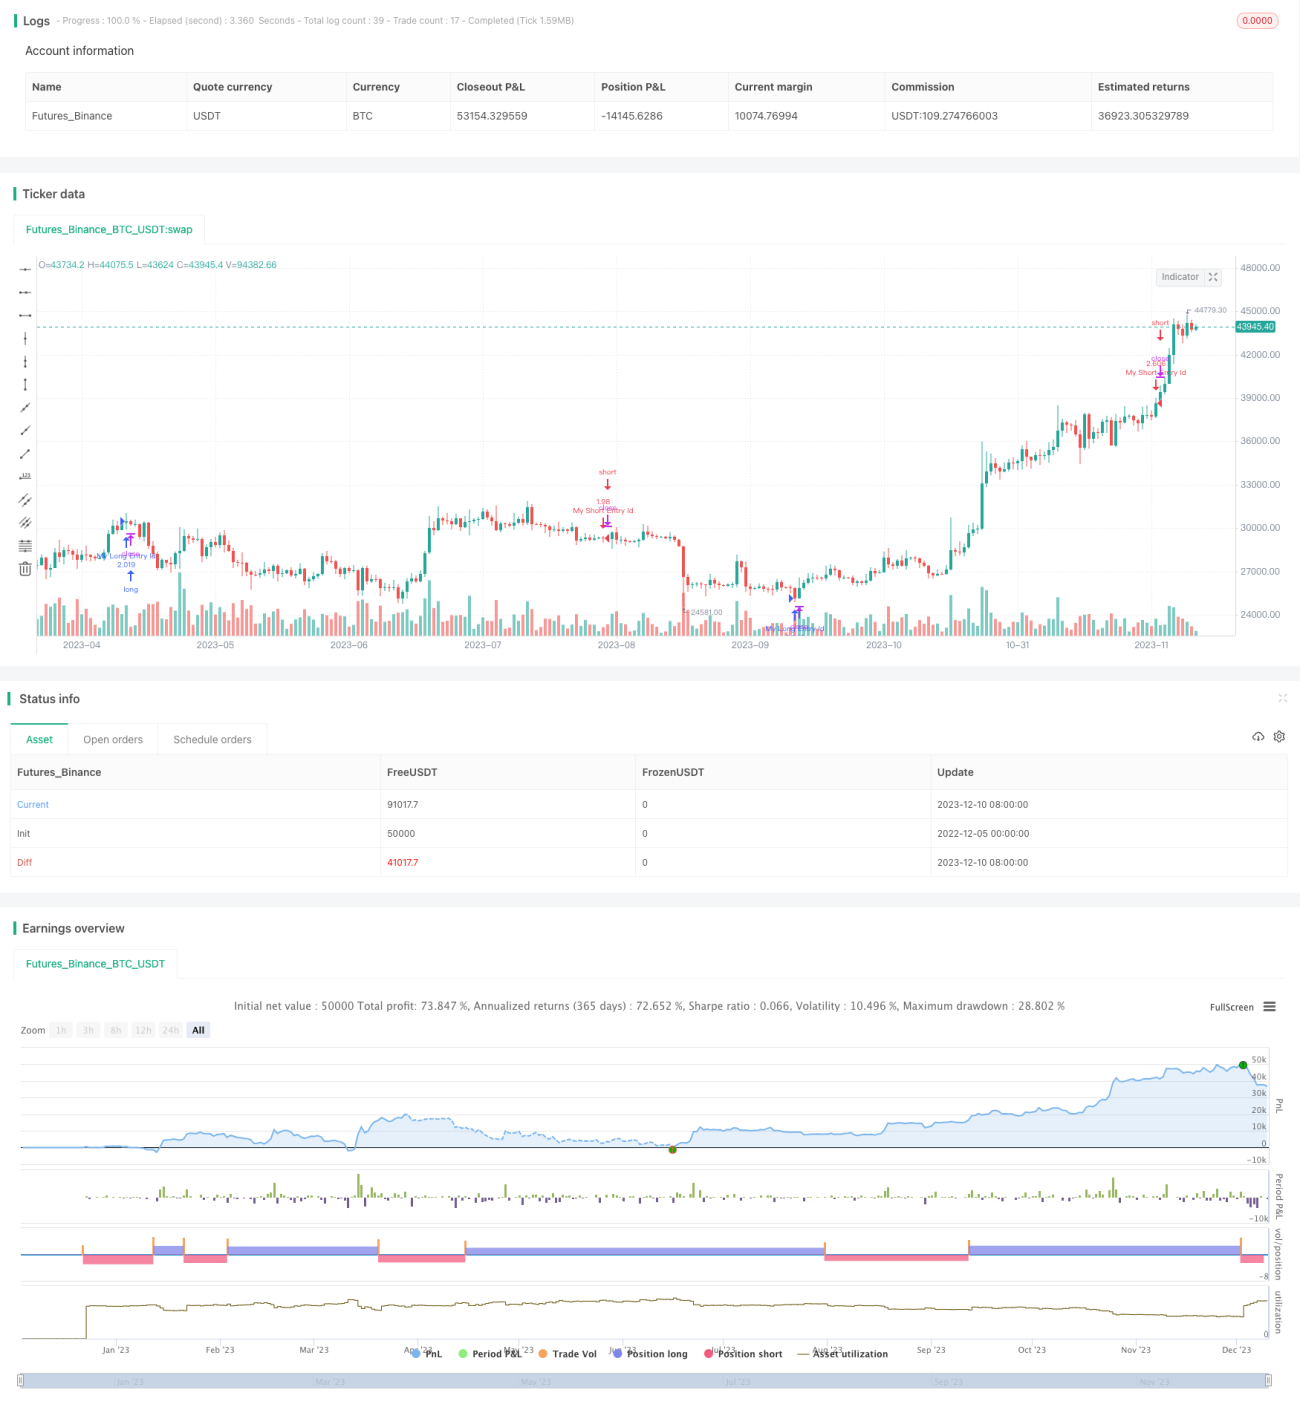
/*backtest
start: 2022-12-05 00:00:00
end: 2023-12-11 00:00:00
period: 1d
basePeriod: 1h
exchanges: [{"eid":"Futures_Binance","currency":"BTC_USDT"}]
*/

//@version=3

strategy("Swing MTF", shorttitle="Swing MTF", overlay=false, default_qty_type = strategy.percent_of_equity, default_qty_value = 100, initial_capital = 10000, slippage = 5)
//- 1