Volume Oscillator Long and Short Term Moving Average Crossover Strategy

Overview
This strategy is based on the crossover of long and short term moving averages of trading volume. It uses EMAs of different periods to calculate the long and short term trends of trading volume, and constructs an oscillator based on their difference. It goes long when the oscillator crosses above the zero level, and goes short when crossing below. It also incorporates previous high and low prices to determine the specific direction.
Strategy Logic
The core indicator of this strategy is Volume Oscillator. It reflects the trend of trading volume change by calculating the difference between long term and short term Exponential Moving Averages. The concrete formula is:
Volume Oscillator = (ShortEMA - LongEMA) / LongEMA * 100
Here ShortEMA and LongEMA refer to short term and long term EMAs respectively. When ShortEMA crosses over LongEMA, the indicator turns positive, implying expanding trading volume. When ShortEMA crosses below LongEMA, the indicator turns negative, implying contracting trading volume.
After calculating the oscillator, this strategy uses its crossover with zero level to generate trading signals. It goes long when the oscillator turns from negative to positive, i.e. crossing above zero level, and goes short when turning from positive to negative, i.e. crossing below zero level. This reflects the momentum conversion of trading volume.
In addition, the strategy also incorporates previous high and low prices to determine specific directions. That is when oscillator crossing above zero level, if previous high price is greater than absolute value of previous low price, it implies a long signal, otherwise a short signal. This feature helps judging the strength of volume expansion.
Advantages
This strategy has the following advantages:
-
Using trading volume as the basis indicator can effectively determine market participants' willingness and is very practical.
-
Incorporating both long term and short term EMAs can capture mid-long term trends and short term momentum simultaneously.
-
The crossing signals formed by indicator and zero level is simple and clear for decision making.
-
Adding previous highs and lows to determine directions can make good use of the momentum size of trading volumes.
-
The strategy logic is straightforward, parameters are flexible for adjustment and it has relatively strong adaptivity.
Risks
Some risks of this strategy need to be noted:
-
Volume indicator can be influenced by market false breakouts, generating wrong signals. Stop loss should be set to control risks.
-
In range-bound markets, volume crossovers may happen frequently. Proper confirmation of indicator's turning points is needed.
-
Previous highs and lows only reflect the latest expansion and cannot determine its sustainability.
-
Parameters need separate optimization for different products and time periods. The universality is limited.
-
Volume indicator reacts slowly to high-frequency algorithmic trading, possibly missing the best entry timing.
Optimization Directions
The strategy can be optimized in the following aspects:
-
Adding filters to avoid false signals, e.g. confirming with price indicators.
-
Optimizing periods of long and short term EMAs to match characteristics of different products.
-
Setting period parameters for previous highs and lows to use maximum and minimum prices of a period.
-
Defining a range for indicator's turning area instead of a single level to avoid over-trading.
-
Adding stop loss strategies to control single loss.
-
Incorporating other volume-based indicators like VRP.
-
Using machine learning methods to auto-optimize parameters.
Summary
In summary, the volume oscillator long short term moving average crossover strategy makes good use of volume reversal features and has strong judging power in the initial stage of trends. Adding previous highs and lows to determine directions makes trading decisions more accurate. Risk control is also important to prevent losses from false signals. This strategy has large room for optimization, in aspects like parameter tuning and combining indicators, to shorten its trading delay and reaction time to market changes.
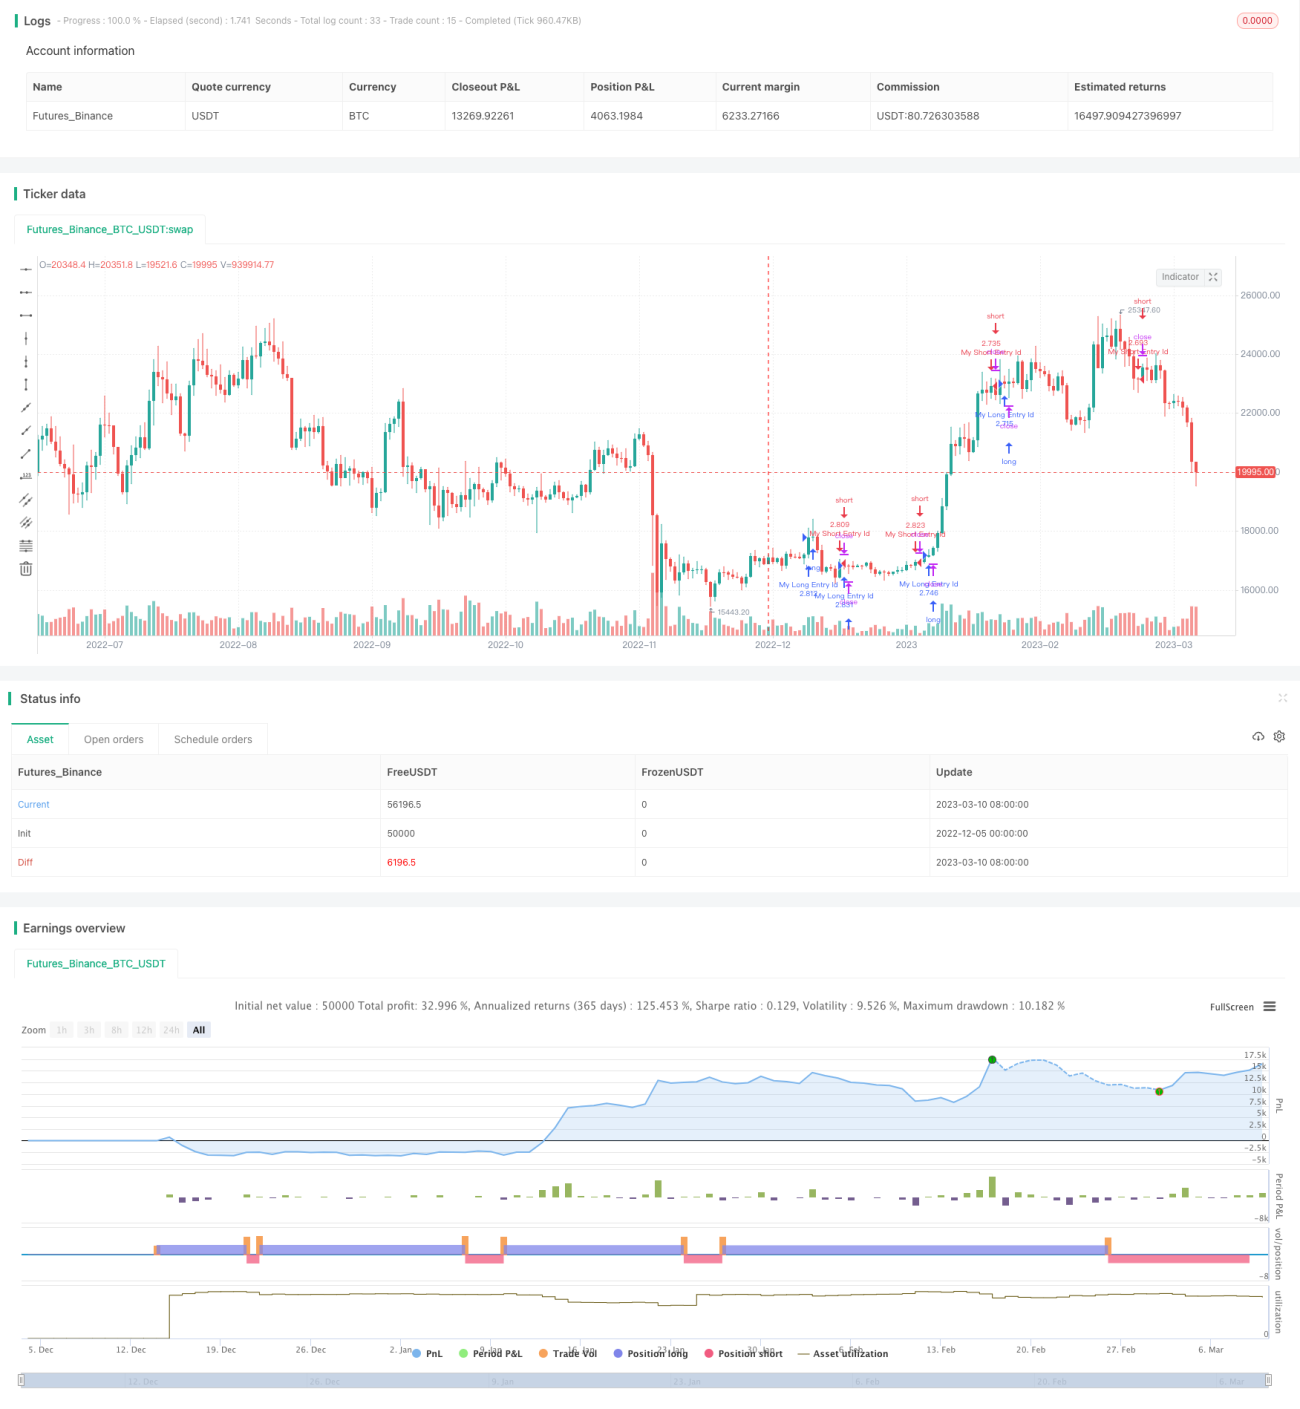
/*backtest
start: 2022-12-05 00:00:00
end: 2023-03-11 00:00:00
period: 1d
basePeriod: 1h
exchanges: [{"eid":"Futures_Binance","currency":"BTC_USDT"}]
*/

//@version=3
strategy("SB_Volume_oscillator_Prev_high_low", overlay=true,default_qty_type = strategy.percent_of_equity, default_qty_value = 100)

shortlen = input(5, minval=1)- 1