EMA & MACD Quantitative Strategy With Dual-Track Running and Leading the Market Index

Overview
This strategy mainly utilizes the EMA moving average line and MACD indicator to determine the changes in market patterns and performs momentum trading strategies. The core idea is to go long when the short-term EMA line crosses above the long-term EMA line and the MACD simultaneously crosses above 0, and go short when the short-term EMA crosses below the long-term EMA and the MACD simultaneously crosses below 0.
Principle
This strategy integrates the moving average line indicator and the MACD indicator.
First, it uses two EMA indicators with different cycle lengths, one is the 25 cycle EMA line and the other is the 50 cycle EMA line. The 25 cycle EMA line can reflect short-term trends while the 50 cycle EMA line reflects medium-and-long term trends. When the short-term EMA line crosses above the long-term EMA line from the bottom, it indicates the market is turning from decline to upside, which is a golden cross signal for going long. When the short-term EMA crosses below the long-term EMA from above, it indicates the market is turning from upside to downside, which is a death cross signal for going short.
At the same time, the strategy also incorporates MACD indicator signals. The MACD indicator includes a DIF line and a DEA line, which represent the difference between short-term and long-term exponential moving averages, calculated by double EMAs. This strategy sets the DIF as the difference between 12-day EMA and 26-day EMA. The DEA line is the 9-day exponential moving average of the DIF. The DIF line represents momentum while the DEA line represents the MACD average. When the DIF crosses above the DEA line from the bottom, it generates a buy signal. When the DIF crosses below the DEA from above, it generates a sell signal.
Combining these two indicators, a long entry signal is generated when the 25-day EMA has a golden cross of the 50-day EMA, while the MACD's DIF line crosses above the DEA line. A short entry signal is generated when the 25-day EMA has a death cross of the 50-day EMA, while the MACD'S DIF line crosses below the DEA line.
Advantage Analysis
This is a very typical dual-track strategy which integrated with the MACD indicator to generate more reliable trading signals with the following advantages:
-
Using dual EMA lines can avoid whipsaws and false breakouts to generate more reliable trading signals.
-
Integrating the MACD indicator can further verify trading signals and avoid the risk of false EMA dual-track signals, improving the practical effectiveness of the strategy.
-
Using the 25-day and 50-day line as the fast and slow line, the parameter selection is more accurate which can capture significant trend changes in medium-and-short term cycles.
-
By chasing momentum and mean reversion mindset, this strategy can outrun the benchmark index and achieve significant returns during sharp uptrends and downtrends on the broader market.
-
The strategy logic is simple and straightforward, easy for understanding and implementation, suitable for quantitative beginners.
-
Parameters can be carefully optimized to better adapt the strategy across different products and market environments.
Risk Analysis
There are still some risks worth noticing for this strategy:
-
The possibility of false EMA signals remains, whipsaw may still occur in violent market movements.
-
MACD parameters need continuous optimization and adjustment, otherwise incorrect signals or signal lags may occur.
-
Need to be cautious of whether the stop loss point setting is reasonable to avoid ineffective breakthroughs causing greater losses.
-
Need to pay attention to changes in market and policy environments to avoid systemic risks causing greater losses.
-
Need to control position sizing and leverage level to prevent the risk of forced liquidation from one-sided trends.
Optimization Directions
This strategy can also be optimized in the following aspects:
-
Test more accurate parameter combinations with higher practical efficiency, such as using 20-day and 60-day EMA lines as trading tracks, with DIF as the difference between 10-day EMA and 20-day EMA.
-
Increase confirmation from trading volume indicators to avoid low-volume false breakouts.
-
Incorporate volatility indicators like ATR to determine more scientific stop loss methods.
-
Utilize machine learning algorithms to automatically optimize parameters for dynamically adapting to changing market environments.
-
Add position sizing control module for dynamically adjusting sizes based on strategy performance and metrics.
-
Can plot strategy signals on higher timeframe charts to assist decisions on longer-term directional trades.
Summary
This strategy integrates the strengths of moving average line indicators and MACD indicators by judging higher quality candlestick patterns through dual EMA lines combined with DIF and DEA matching on MACD momentum direction, forming a steady and efficient momentum trading strategy. The logic is simple and easy to understand and optimize, very suitable for quant traders to get started and implementation. Through continuous testing and optimizing, this strategy can become one of the value strategies that outperforms indices.
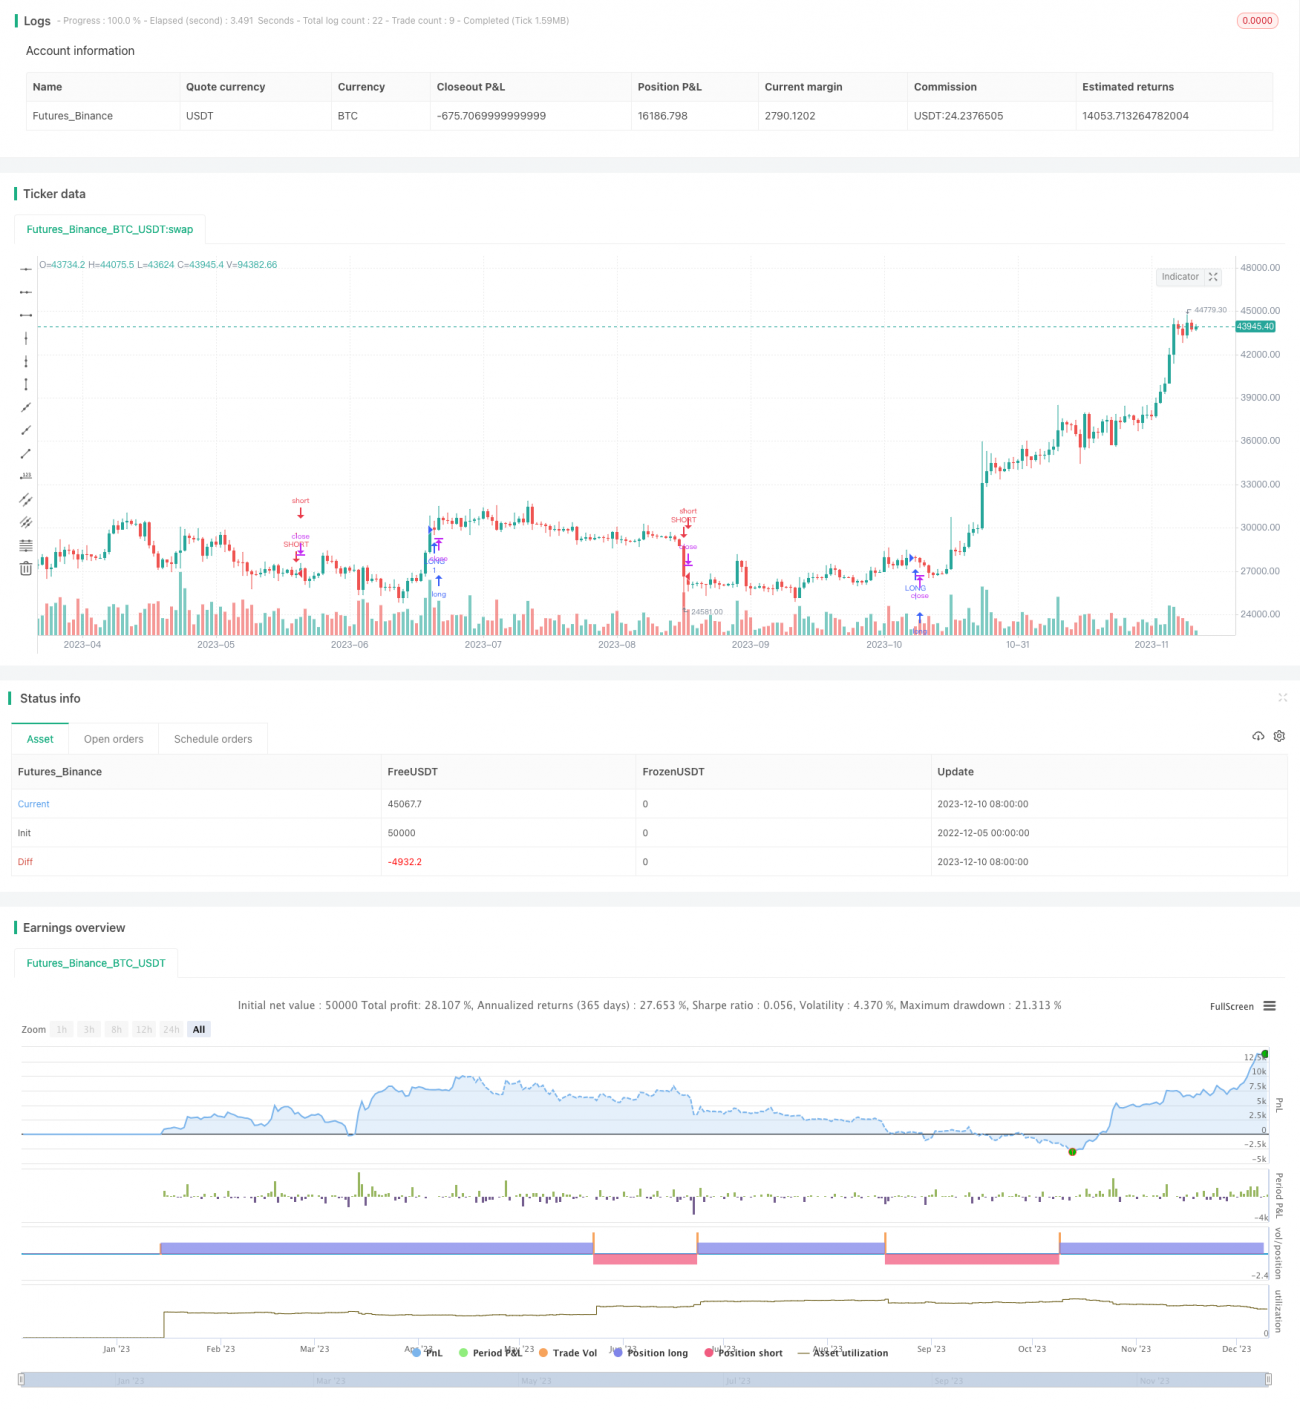
/*backtest
start: 2022-12-05 00:00:00
end: 2023-12-11 00:00:00
period: 1d
basePeriod: 1h
exchanges: [{"eid":"Futures_Binance","currency":"BTC_USDT"}]
*/

//@version=4
strategy(title="EMA+MACD", shorttitle="EMA+MACD", overlay=true)
// Getting inputs
fast_length = input(title="Fast Length", type=input.integer, defval=12)- 1